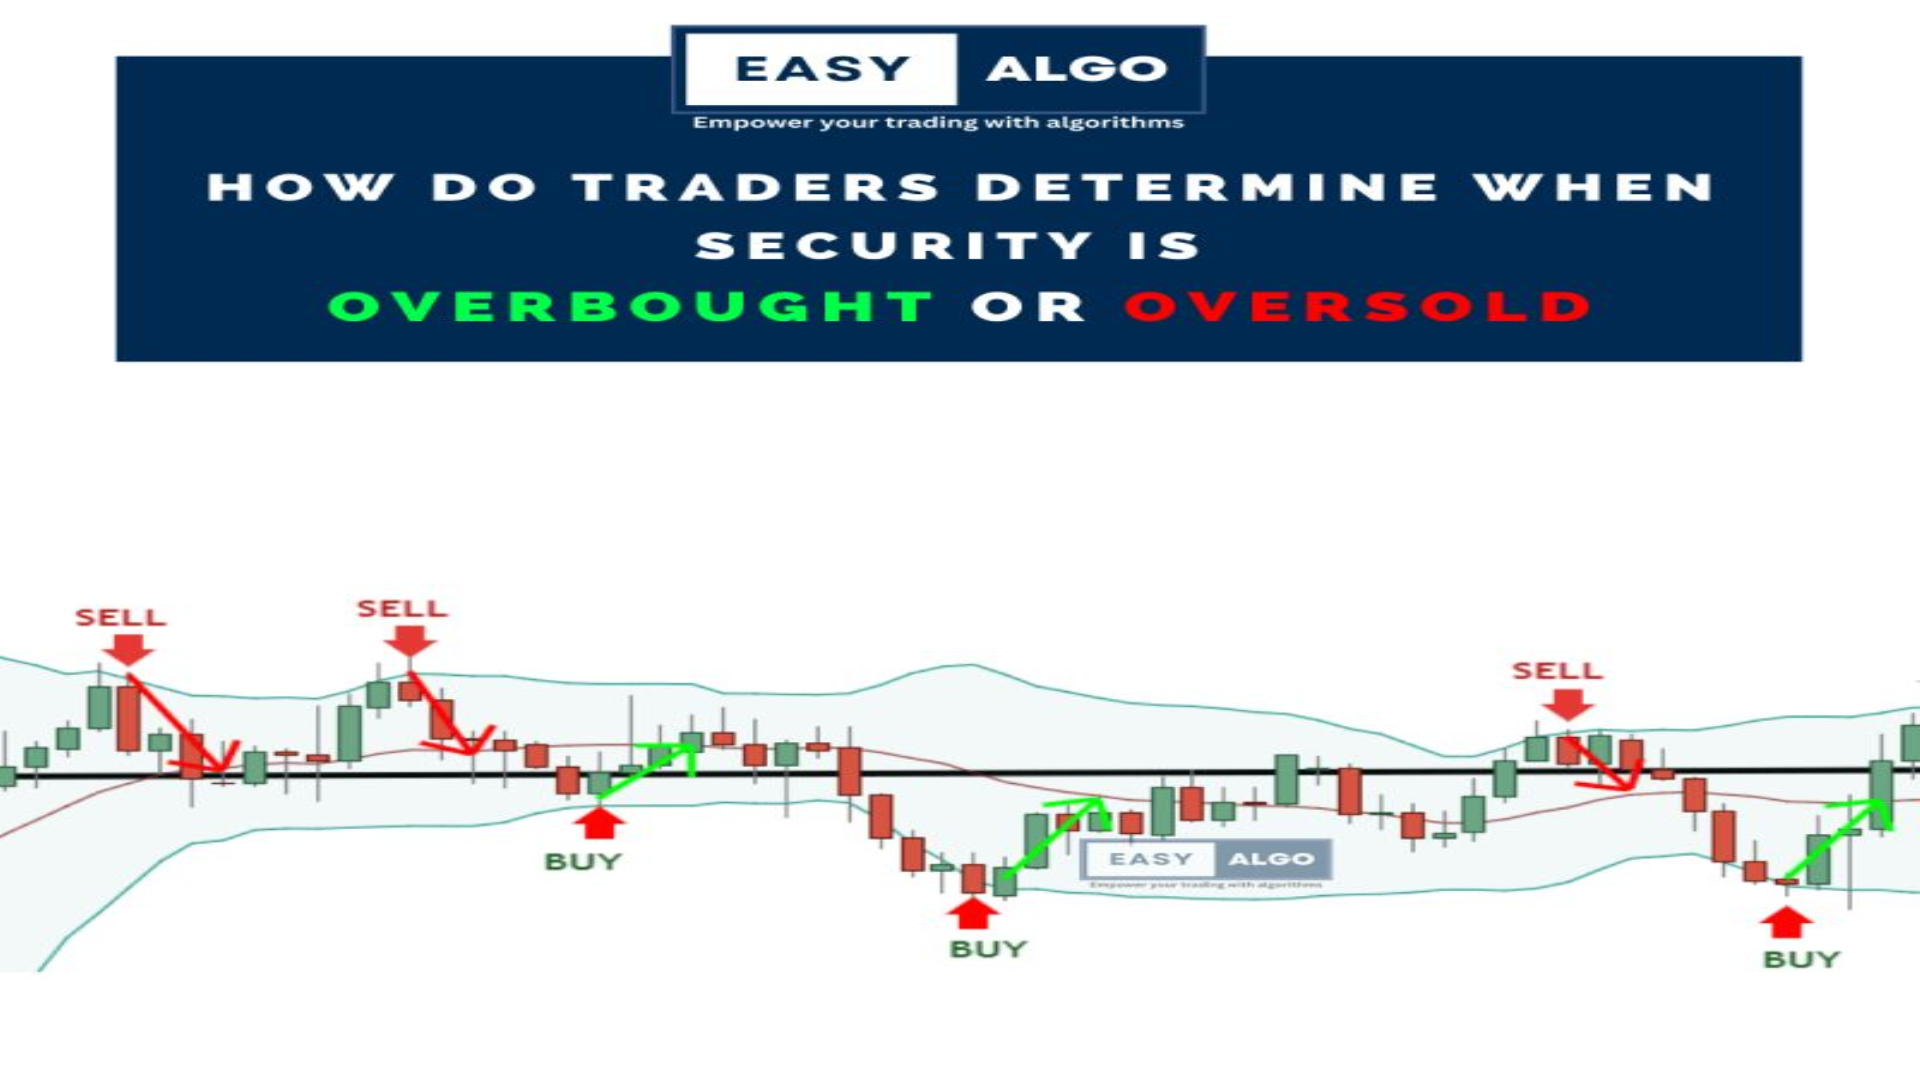
How do traders determine when a security is overbought or oversold ?
Traders use various technical indicators to determine when a security is overbought or oversold.
These indicators are typically based on price and volume data and can help traders identify
potential price reversals.
Here are some of the most common technical indicators used to determine
overbought or oversold conditions:
Relative Strength Index (RSI): The RSI is a momentum oscillator that measures the speed and change
of price movements. It ranges from 0 to 100 and is typically considered overbought when it reaches
70 or above and oversold when it reaches 30 or below.
Moving Average Convergence Divergence (MACD): The MACD is a trend-following indicator that measures
the relationship between two moving averages.
When the MACD line crosses above the signal line, it's
considered a bullish signal, and when the MACD line crosses below the signal line, it's considered a
bearish signal.
Stochastic Oscillator: The Stochastic Oscillator is a momentum indicator that compares a security's
closing price to its price range over a certain period.
It ranges from 0 to 100 and is typically
considered overbought when it reaches 80 or above and oversold when it reaches 20 or below.
Bollinger Bands: Bollinger Bands are a volatility indicator that measure the standard deviation of a
security's price over a certain period.
They consist of an upper band, a lower band, and a middle
band, which is typically a moving average.
When the price moves outside of the upper or lower band,
it's considered overbought or oversold, respectively.
Traders may use one or more of these indicators to determine when a security is overbought or
oversold and make trading decisions accordingly.
It's important to note that these indicators are
not foolproof and should be used in conjunction with other analysis techniques to make informed
trading decisions.
At EasyAlgo, we specialize in automating trading strategies and backtesting them to ensure maximum
profitability.
If you have a trading idea but don't know how to automate it, or if you want to
backtest your trading strategy but don't know where to start, contact us at +91-8851987919 or visit
our website at easyalgo.in
Don't miss out on the potential profits that come with trading smarter, not harder. Let EasyAlgo
help you take your trading strategy to the next level.

