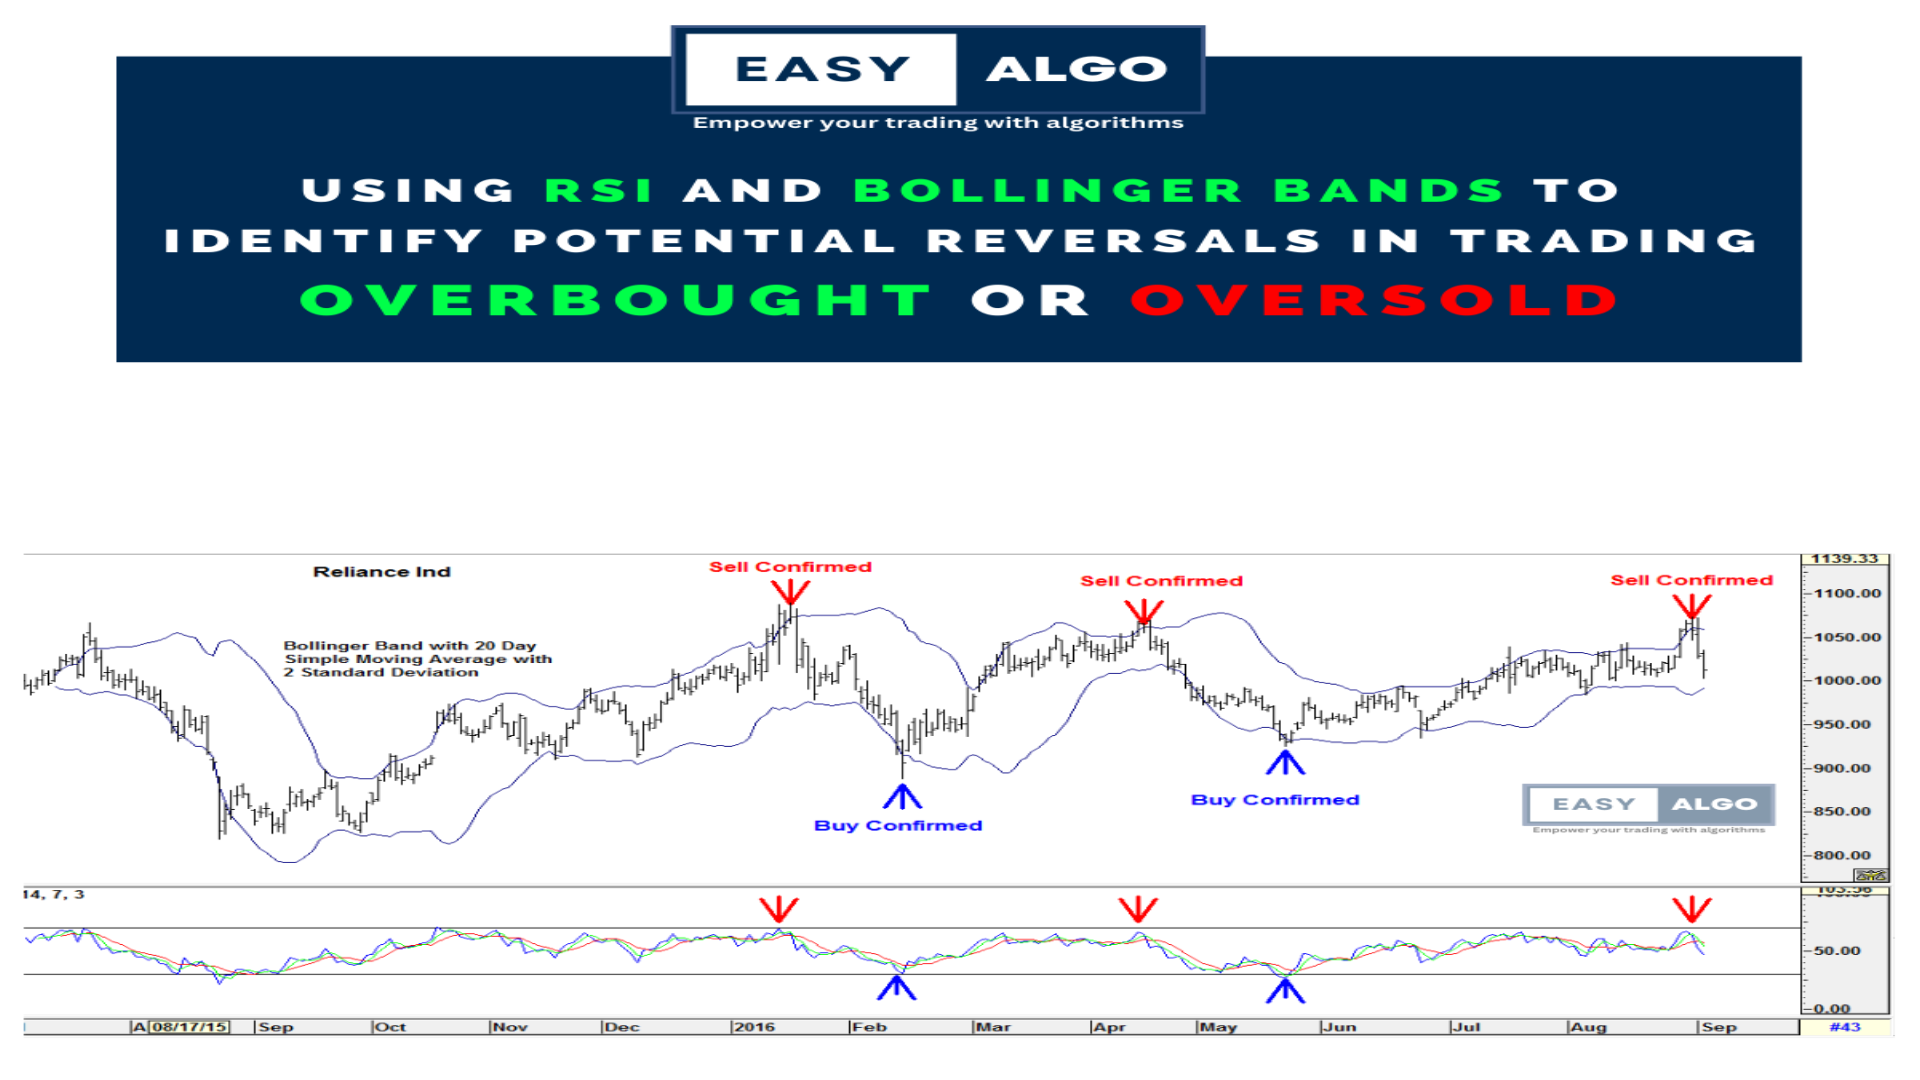
As a trader, I've found that using technical indicators like the RSI and Bollinger Bands can help me
identify potential reversals in an asset's price action.
By monitoring the overbought and oversold
levels of both indicators, I can get a better understanding of the overall trend and momentum of an
asset.
When the RSI reaches overbought levels above 70 and the price touches the upper Bollinger
Band, it may indicate that the asset is overbought and due for a reversal to the downside.
Conversely, when the RSI reaches oversold levels below 30 and the price touches the lower Bollinger
Band, it may signal that the asset is oversold and due for a reversal to the upside.
But let's face it, constantly monitoring these levels can be time-consuming and exhausting.
That's
why algorithmic trading has become increasingly popular among traders.
By converting your trading
strategy into an automated process, you can sit back and relax knowing that your trading process is
more efficient and effective than ever before.
If you're interested in automating your trading process, With Easy Algo, you can easily convert your
trading strategy into an automated process that executes trades on your behalf.
Contact us at
+91-8851987919 or visit our website at easyalgo.in for more information.

