Understanding Common Technical Indicators and Their Applications
Technical indicators are mathematical calculations based on the price, volume, or open interest of a security or contract. Traders use them to analyze price movements and forecast future price trends. In this comprehensive guide, we'll explore some of the most common technical indicators, how to use them, their pros and cons, and provide insight into their calculation methods.
1. Moving Averages (MA)
Overview
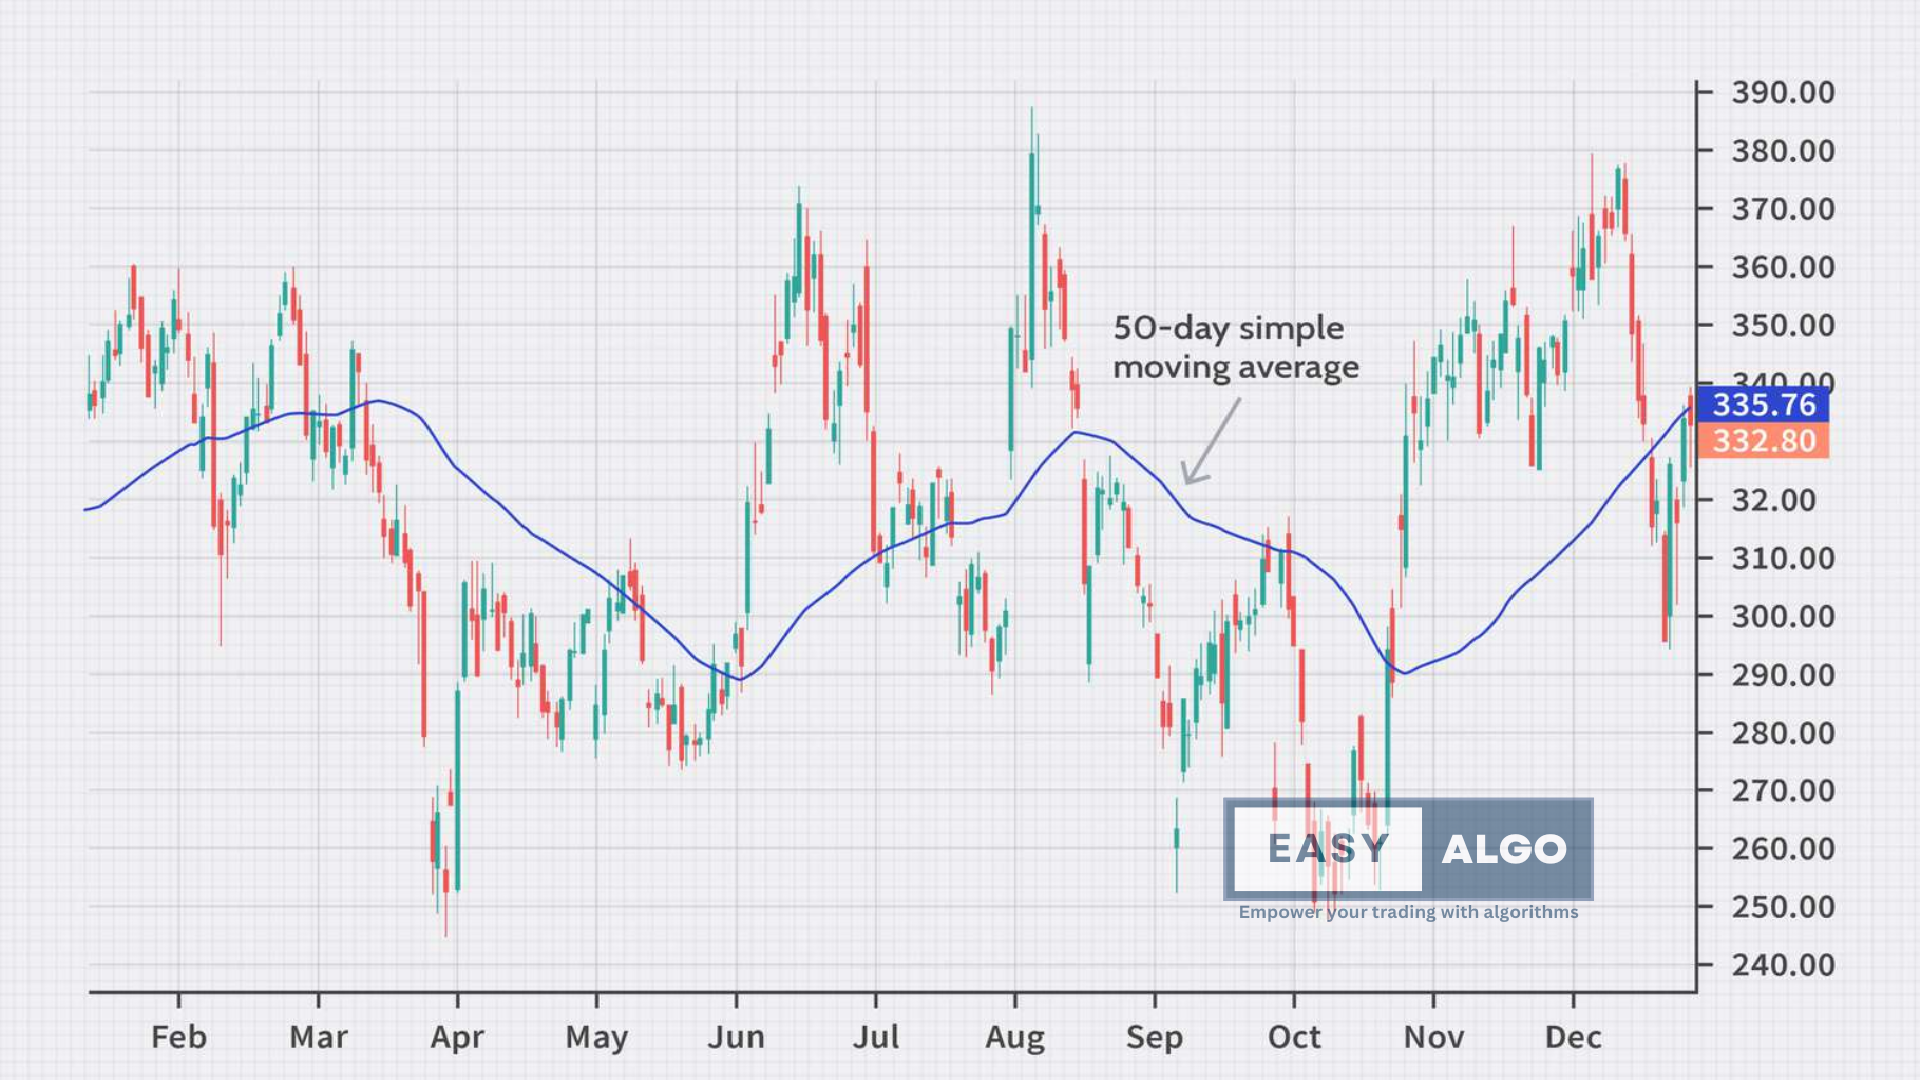
Moving averages smooth out price data to create a single flowing line that traders use to identify the direction of the trend. The two most popular types are the Simple Moving Average (SMA) and the Exponential Moving Average (EMA).
Calculation
Simple Moving Average (SMA):
- Formula: SMA = (Sum of Closing Prices for n Periods) / n
- Example: For a 50-day SMA, sum the closing prices of the last 50 days and divide by 50.
Exponential Moving Average (EMA):
- Formula: EMA = (Closing Price - EMA(previous day)) × (2 / (n + 1)) + EMA(previous day)
- Example: Calculate the 12-day EMA iteratively, starting with the SMA for the first 12 days.
How to Use
- Crossovers: Signal potential trend changes when shorter-term MAs cross above or below longer-term MAs.
- Trend Confirmation: Use in conjunction with volume indicators or oscillators like RSI for confirmation.
Pros
- Trend Identification: Helps identify the direction of the trend.
- Smoothing: Reduces noise in price data.
Cons
- Lagging Indicator: Moving averages are based on past prices and may not predict future movements.
- False Signals: Can produce false signals in a choppy or sideways market.

2. Relative Strength Index (RSI)
Overview
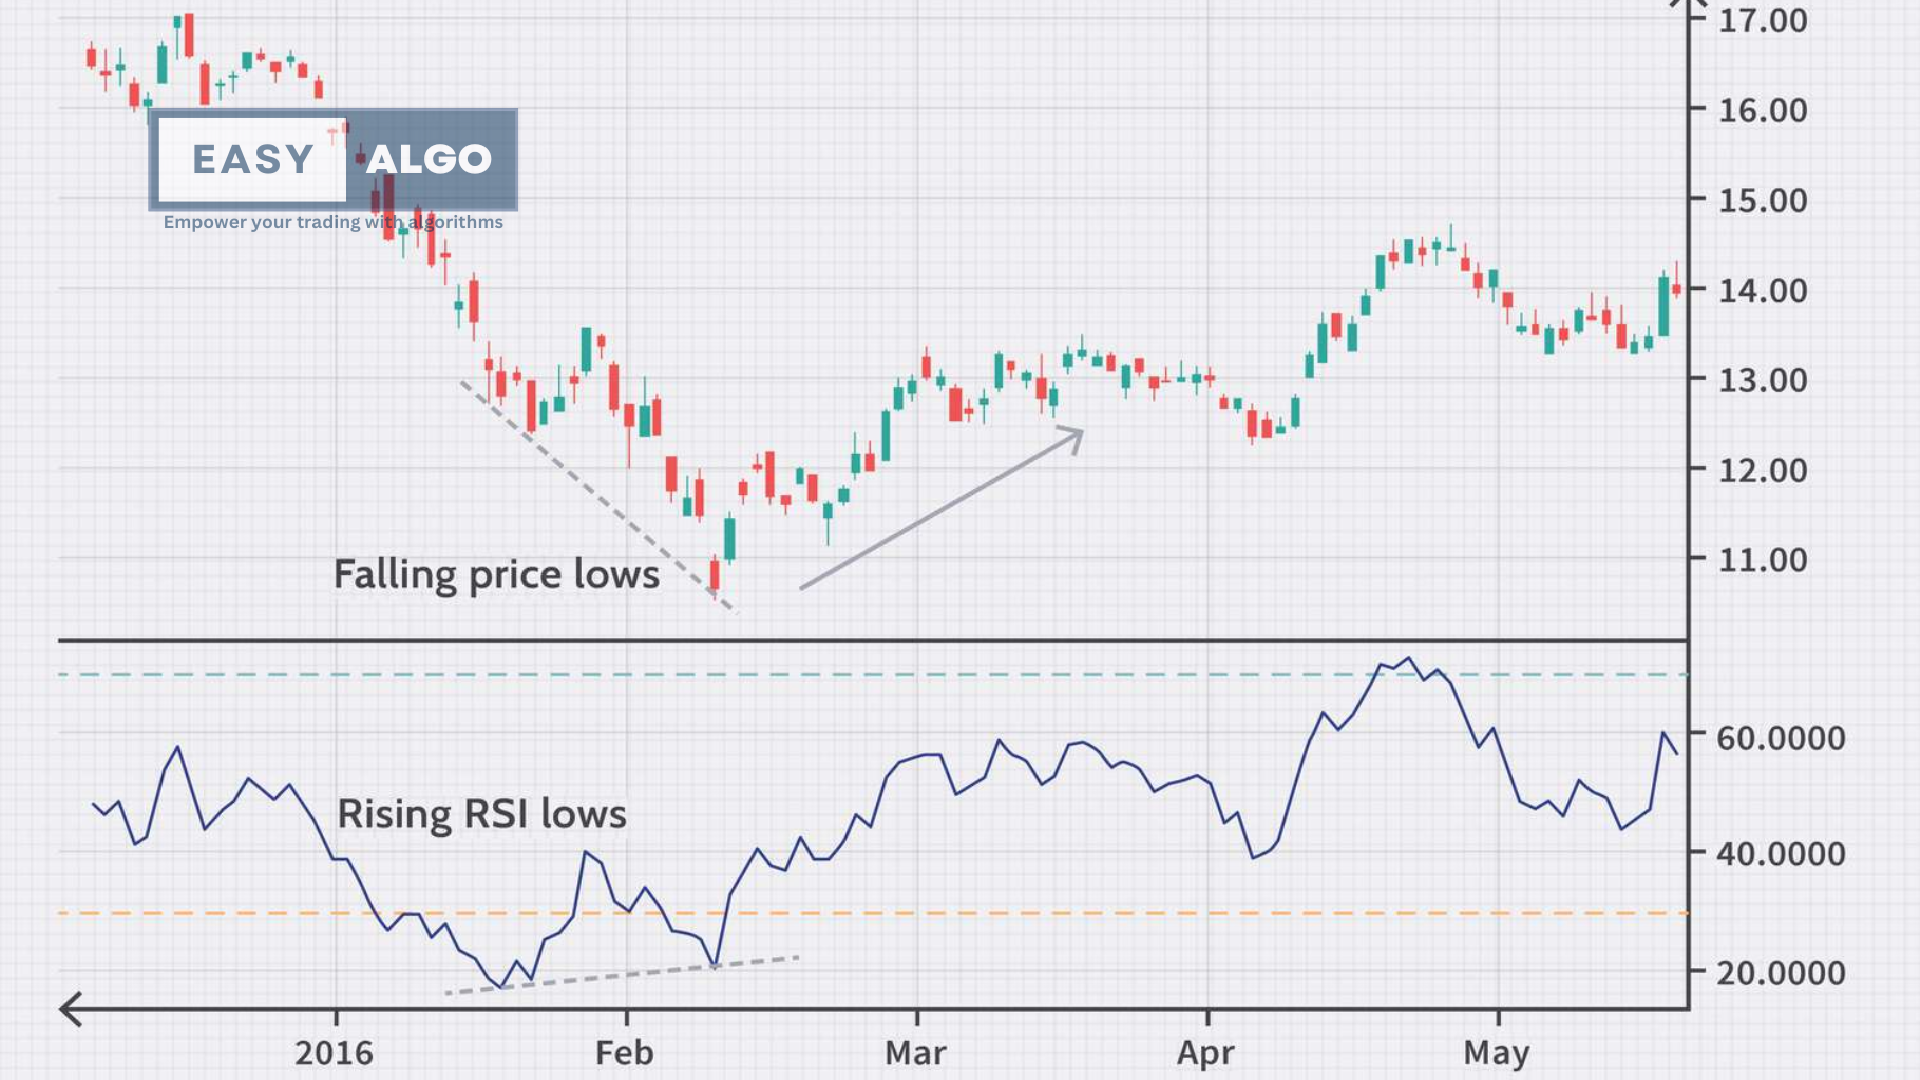
The Relative Strength Index (RSI) is a momentum oscillator that measures the speed and change of price movements. RSI oscillates between 0 and 100, and is typically used to identify overbought or oversold conditions in a market.
Calculation
- RS = Average Gain of n days UP / Average Loss of n days DOWN
- RSI = 100 - (100 / (1 + RS))
- Example: A 14-day RSI uses the average of 14 periods.
How to Use
- Overbought/Oversold: RSI values above 70 may indicate overbought conditions, while values below 30 may indicate oversold conditions.
- Divergence: Look for divergence between RSI and price as a potential reversal signal.
Pros
- Momentum Identification: Helps identify the strength of the trend.
- Reversal Signals: Can provide early warning signals for potential trend reversals.
Cons
- False Signals: RSI can produce false signals in a strongly trending market.
- Lagging Indicator: Like most technical indicators, RSI is based on past price movements.

3. Moving Average Convergence Divergence (MACD)
Overview
The MACD is a trend-following momentum indicator that shows the relationship between two moving averages of a security’s price. The MACD is calculated by subtracting the 26-period EMA from the 12-period EMA.
Calculation
- MACD Line: 12-day EMA - 26-day EMA
- Signal Line: 9-day EMA of the MACD Line
- MACD Histogram: MACD Line - Signal Line
How to Use
- Crossovers: When the MACD Line crosses above the Signal Line, it may be a bullish signal. Conversely, when it crosses below, it may be a bearish signal.
- Divergence: Divergence between MACD and price can indicate a potential trend reversal.
- Histogram: The MACD histogram can be used to identify the strength of the trend.
Pros
- Versatile: Can be used to identify both trend direction and momentum.
- Early Signals: Can provide early signals for potential trend reversals.
Cons
- Lagging Indicator: Based on past price movements, may not predict future price movements.
- False Signals: Can produce false signals in choppy or sideways markets.
4. Bollinger Bands
Overview
Bollinger Bands are volatility bands placed above and below a moving average. Volatility is based on the standard deviation, which changes as volatility increases and decreases. The bands automatically widen when volatility increases and contract when volatility decreases.
Calculation
- Middle Band = 20-day SMA
- Upper Band = 20-day SMA + (2 × 20-day standard deviation of price)
- Lower Band = 20-day SMA - (2 × 20-day standard deviation of price)
How to Use
- Volatility: Bands widen during periods of high volatility and contract during periods of low volatility.
- Price Reversal: When price touches the upper or lower band, it can indicate a potential reversal.
Pros
- Adaptable: Adjust to volatility changes.
- Reversal Signals: Can help identify potential reversal points.
Cons
- False Signals: Can produce false signals in a strong trend.
- Lagging Indicator: Based on past price movements.
Conclusion
Technical indicators are essential tools in a trader’s arsenal. They provide insight into market trends, momentum, and potential reversal points. However, they are not foolproof and should be used in conjunction with other analysis methods and risk management strategies. By understanding the strengths and weaknesses of each indicator, traders can make more informed decisions and increase their chances of success in the markets.
