Candlestick Patterns
Candlestick patterns are a cornerstone of technical analysis, providing visual cues that help traders make informed decisions. These patterns reflect market sentiment and potential price movements.
10 Key Candlestick Patterns
Doji
Description: A Doji represents indecision in the market. The open and close prices are virtually identical. Usage: Indicates a potential reversal or continuation, depending on the preceding trend.
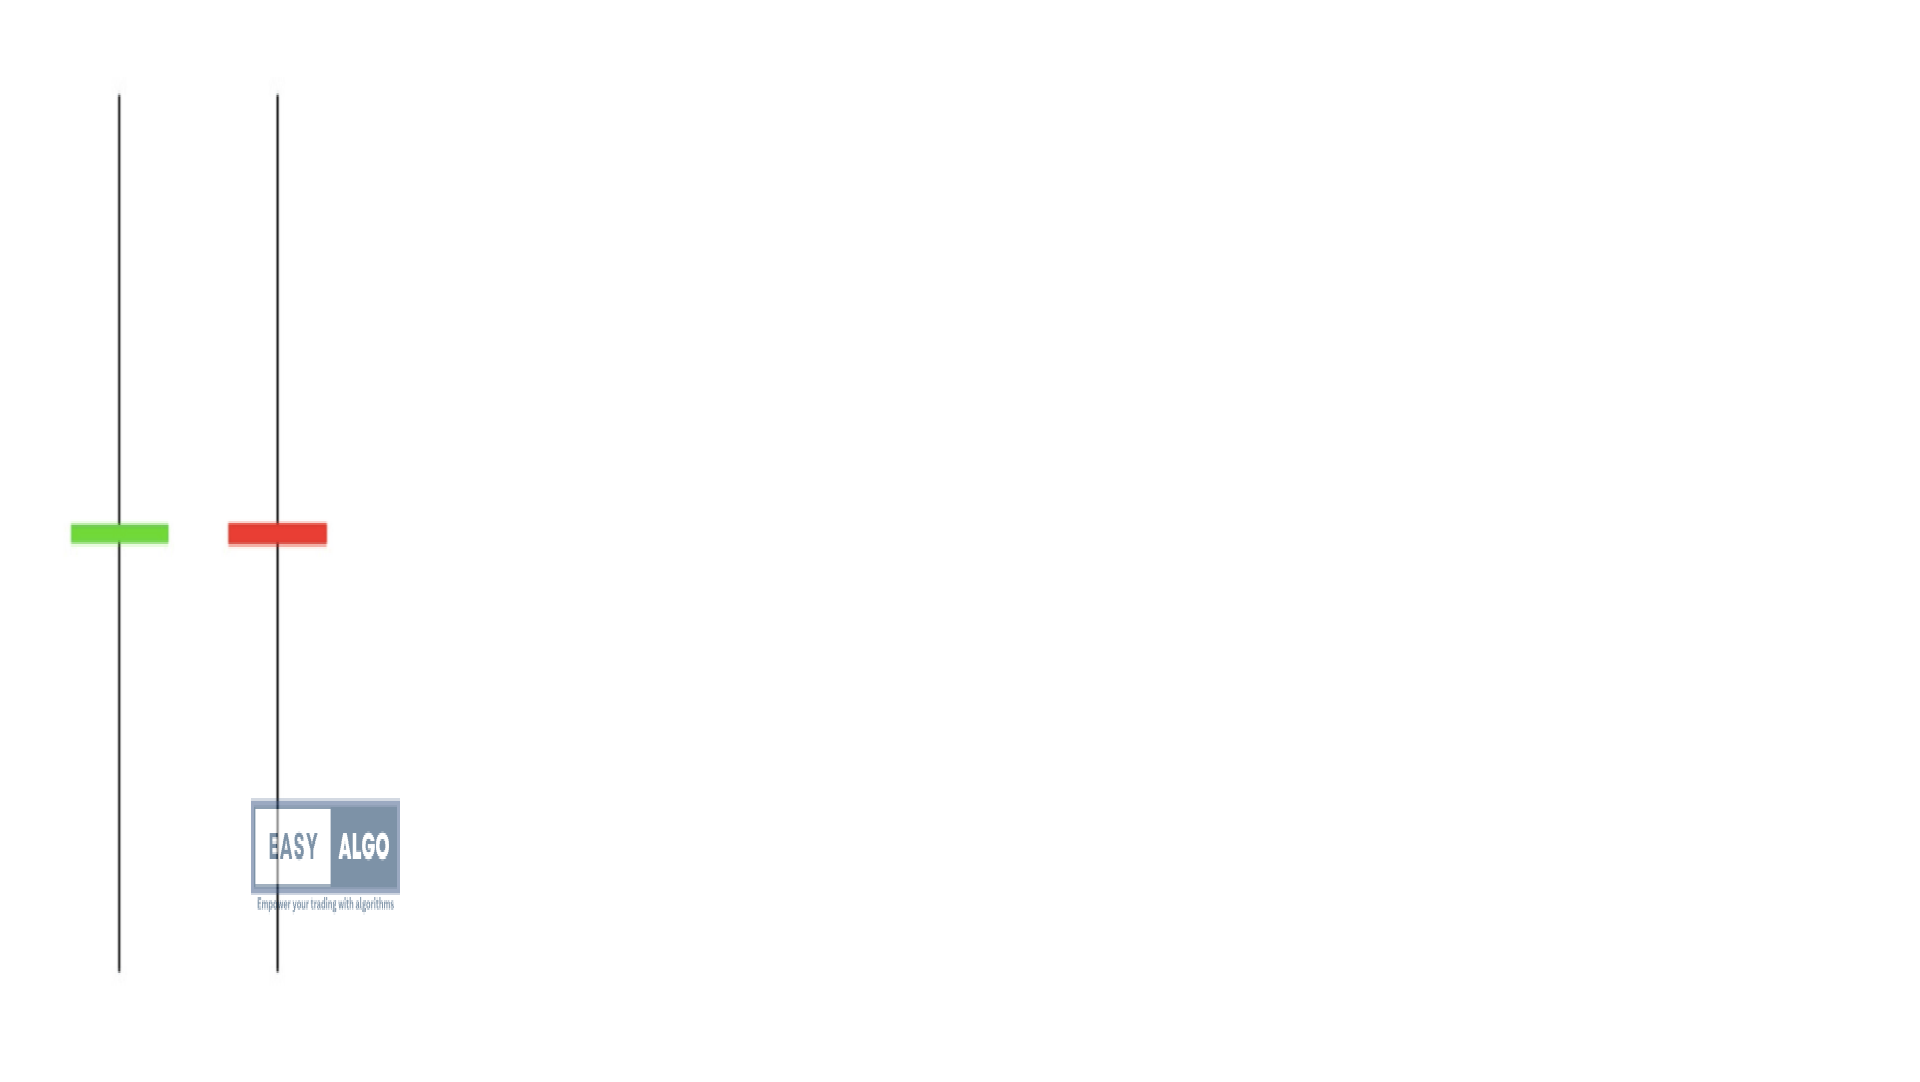
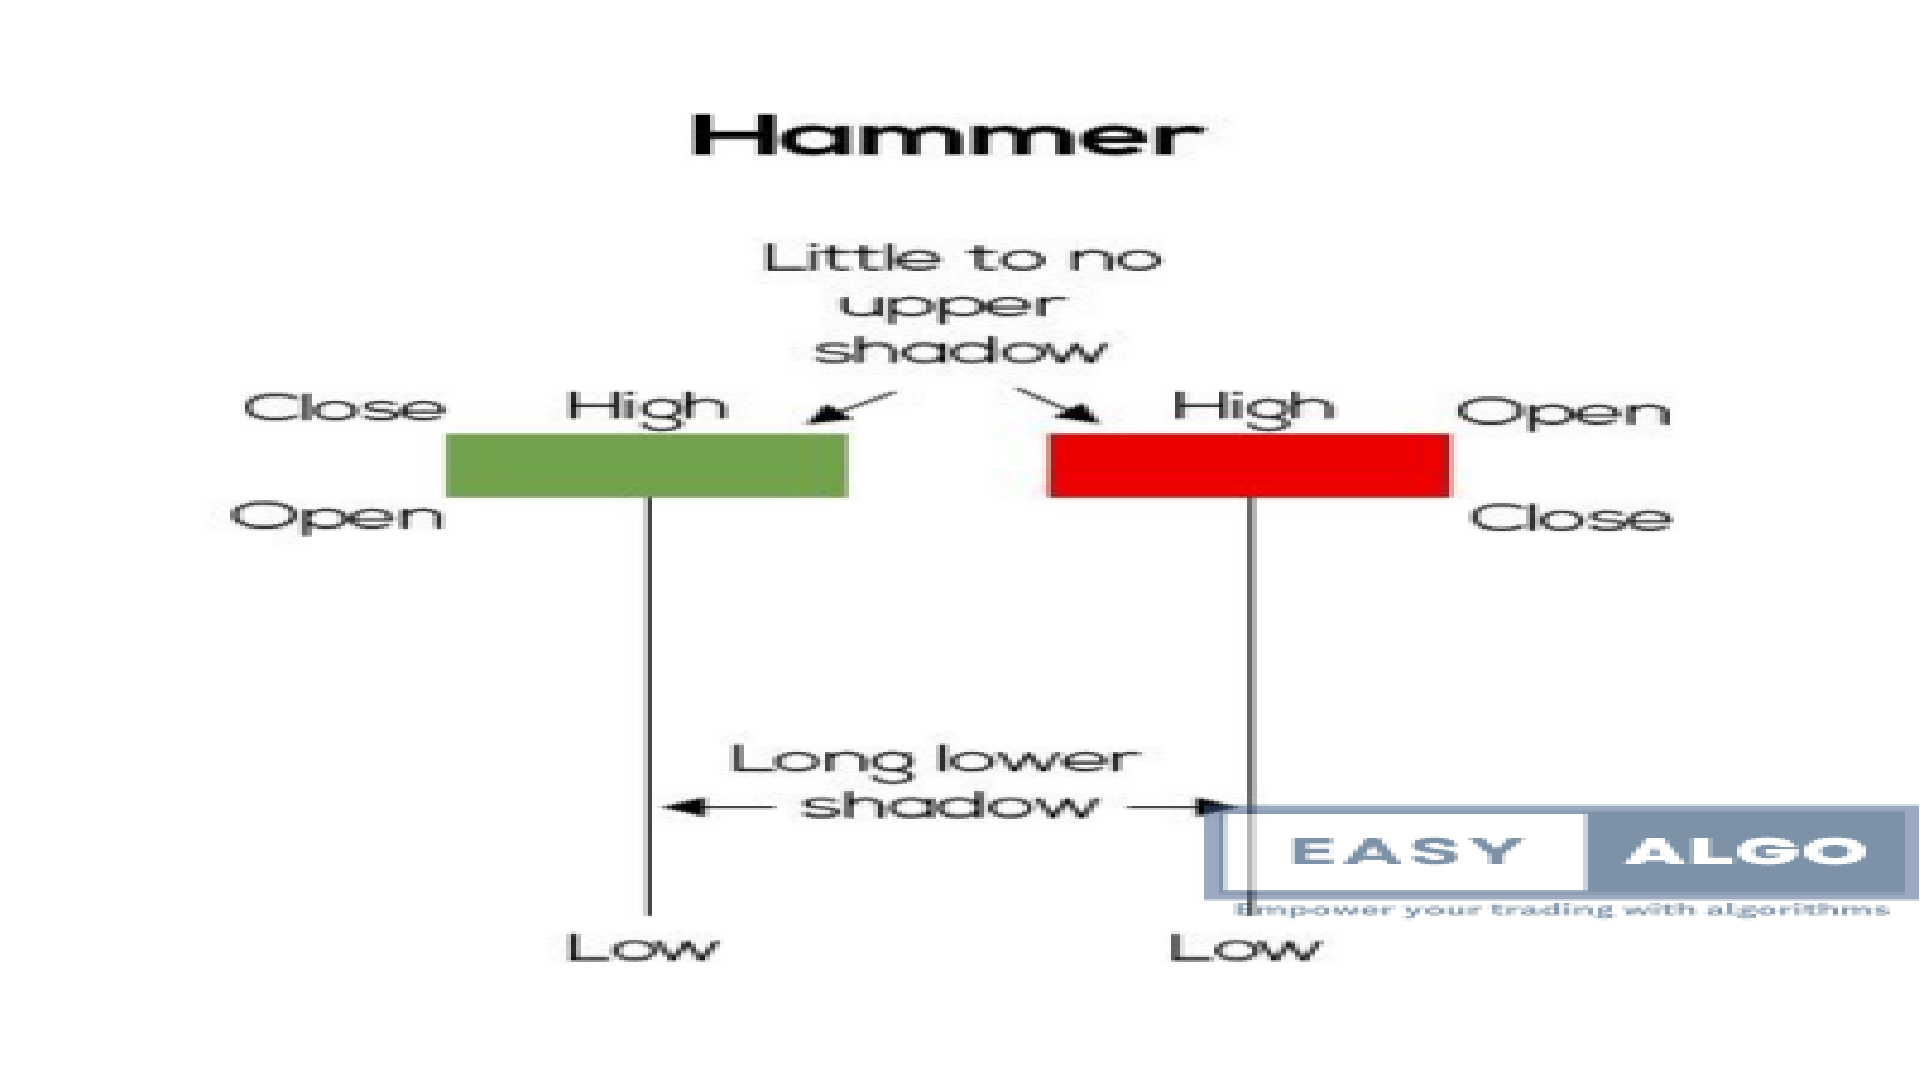
Hammer
Description: A bullish reversal pattern with a long lower shadow and a small body at the top. Usage: Indicates a potential bottom reversal after a downtrend.
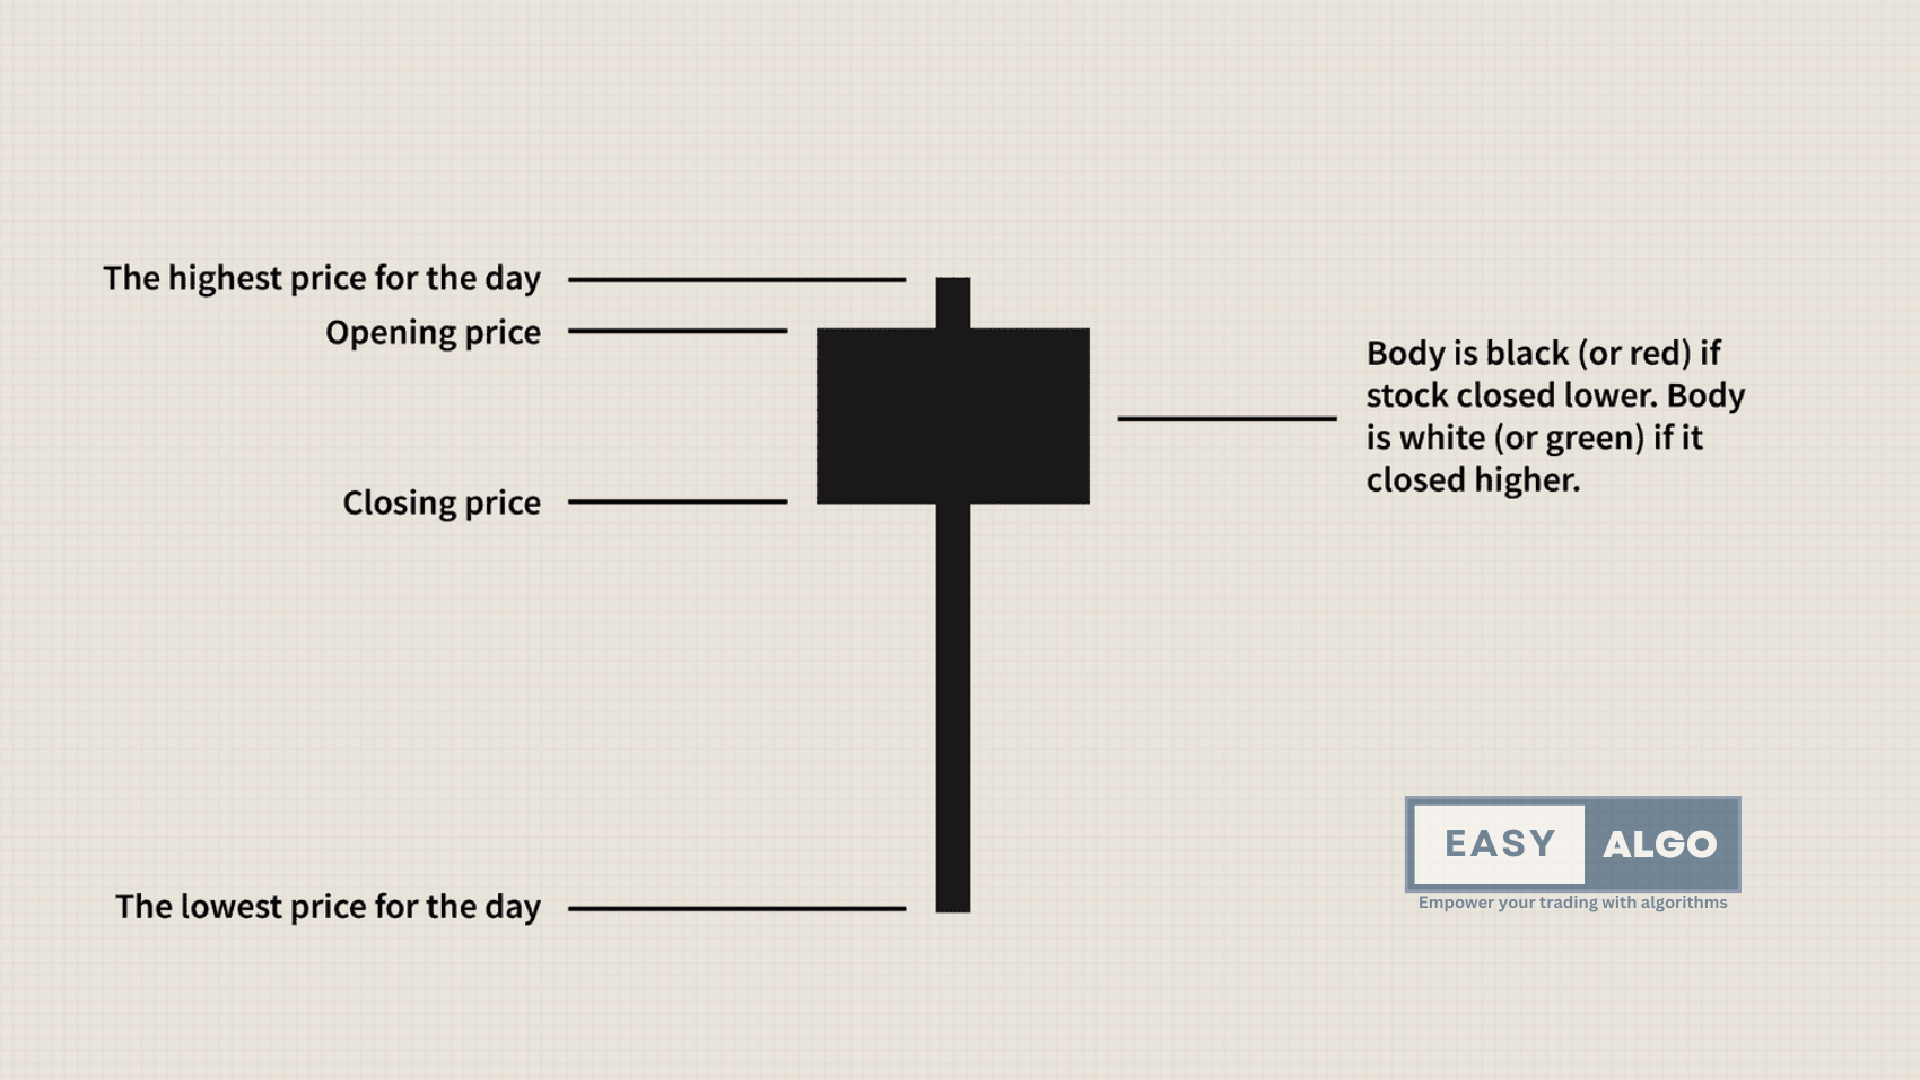
Hanging Man
Description: A bearish reversal pattern with a long lower shadow and a small body at the top. Usage: Indicates a potential top reversal after an uptrend.
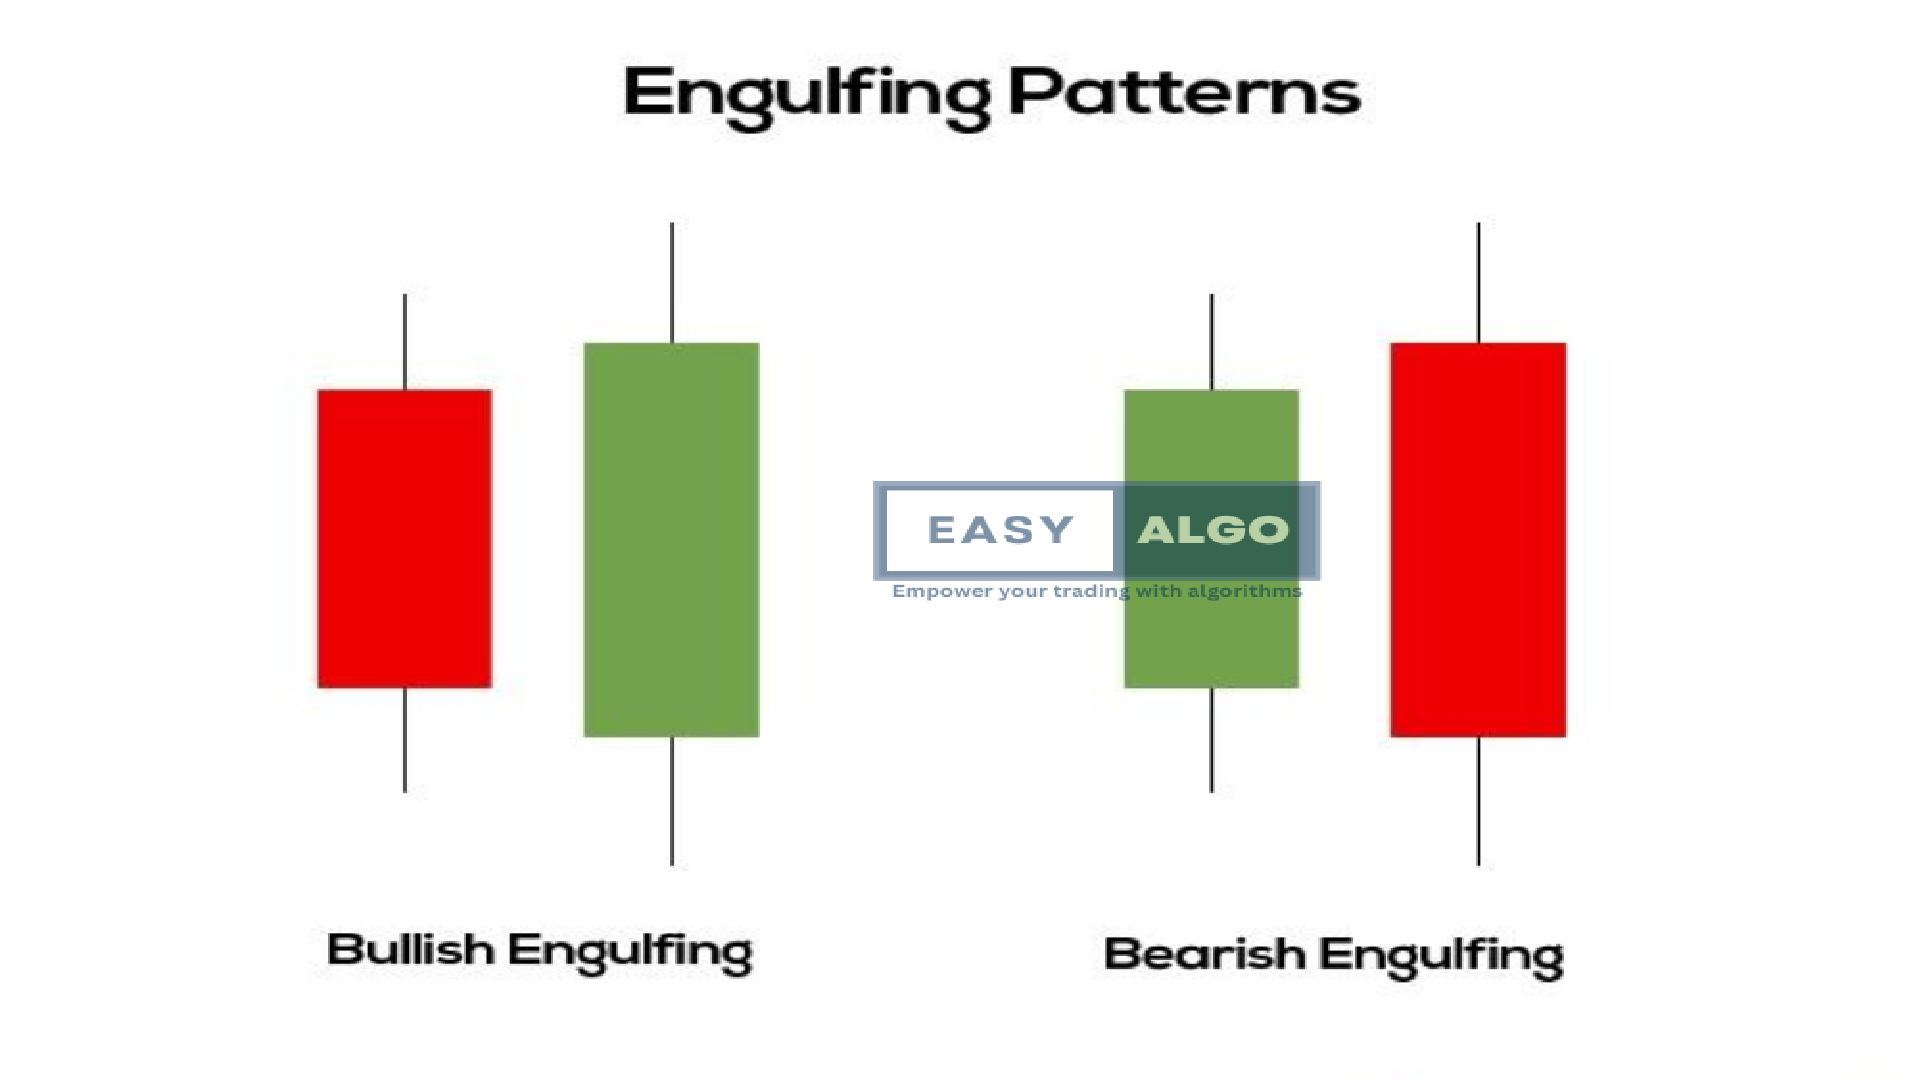
Bullish Engulfing
Description: A two-candle pattern where a small bearish candle is followed by a larger bullish candle. Usage: Indicates strong buying pressure and a potential reversal.
Bearish Engulfing
Description: A two-candle pattern where a small bullish candle is followed by a larger bearish candle. Usage: Indicates strong selling pressure and a potential reversal.
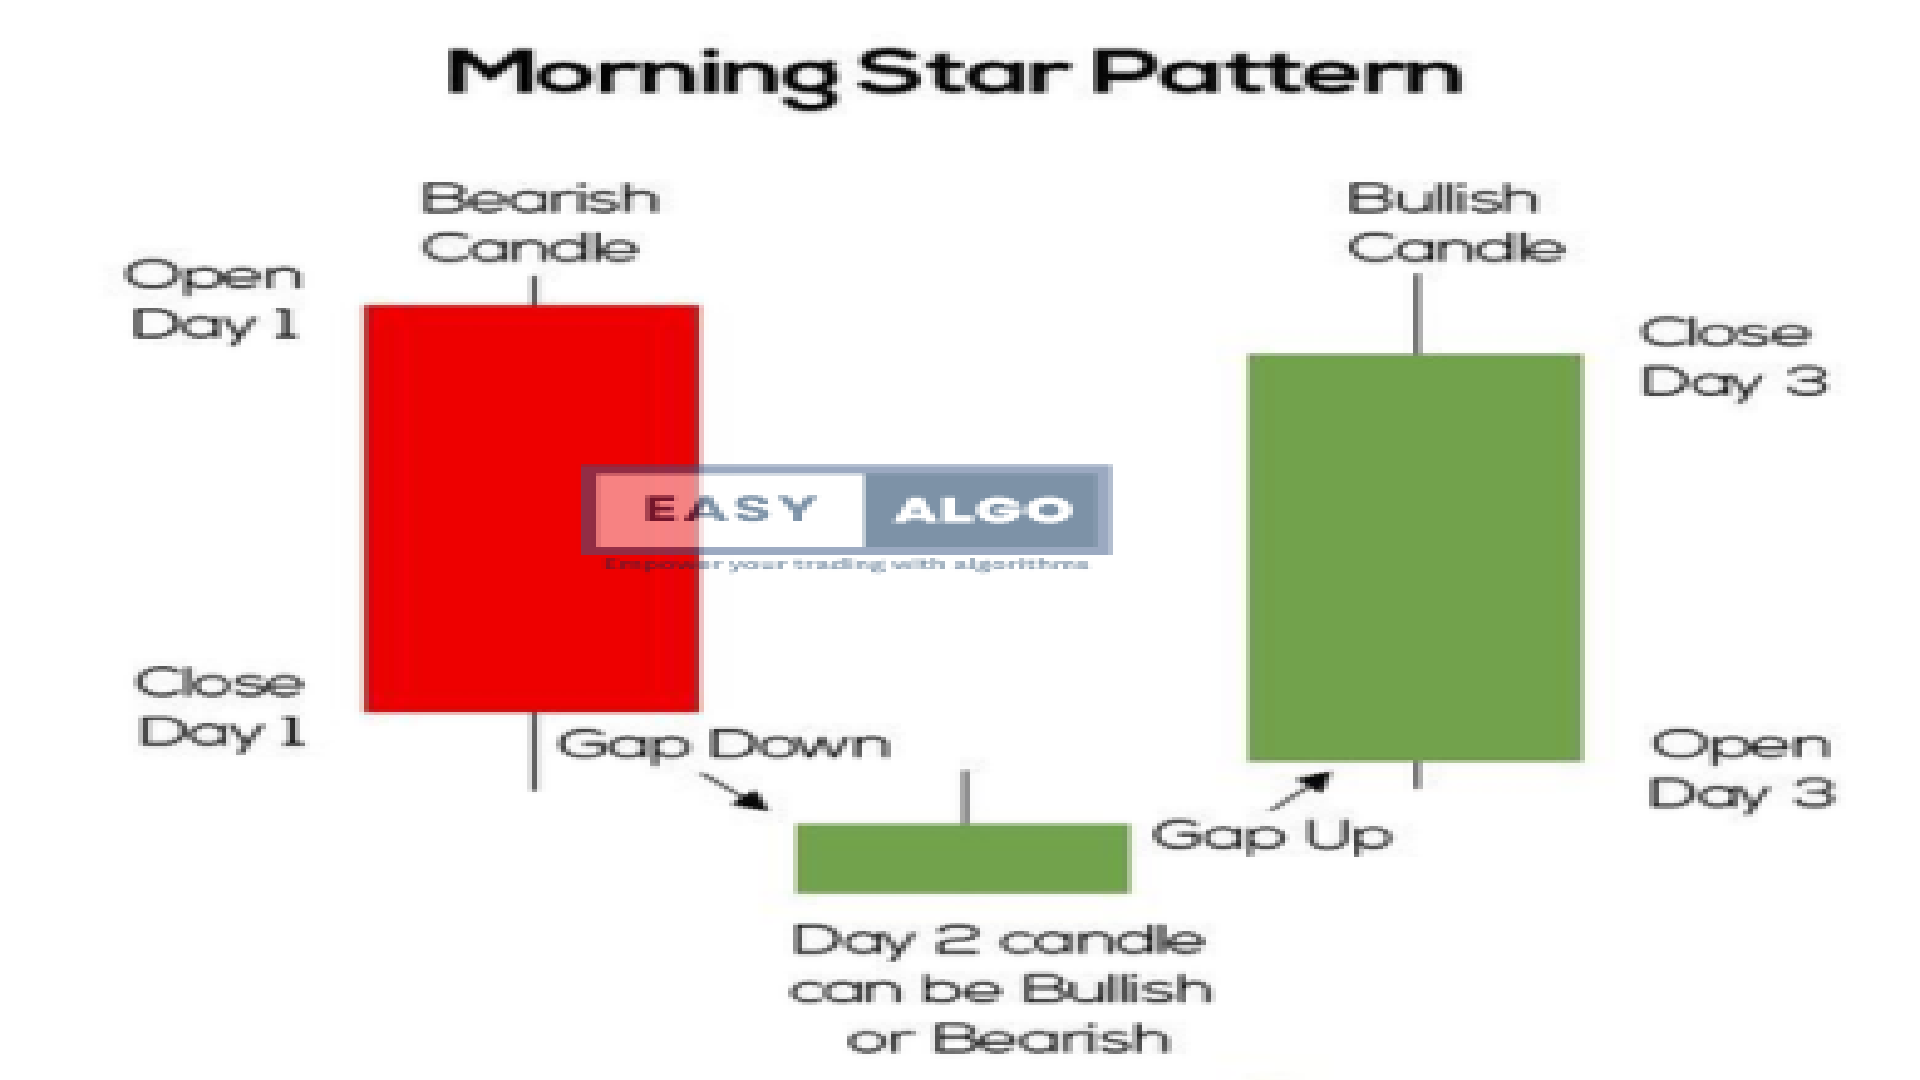
Morning Star
Description: A three-candle bullish reversal pattern with a long bearish candle, a small indecisive candle, and a long bullish candle. Usage: Indicates the end of a downtrend and the beginning of an uptrend.
Evening Star
Description: A three-candle bearish reversal pattern with a long bullish candle, a small indecisive candle, and a long bearish candle. Usage: Indicates the end of an uptrend and the beginning of a downtrend.
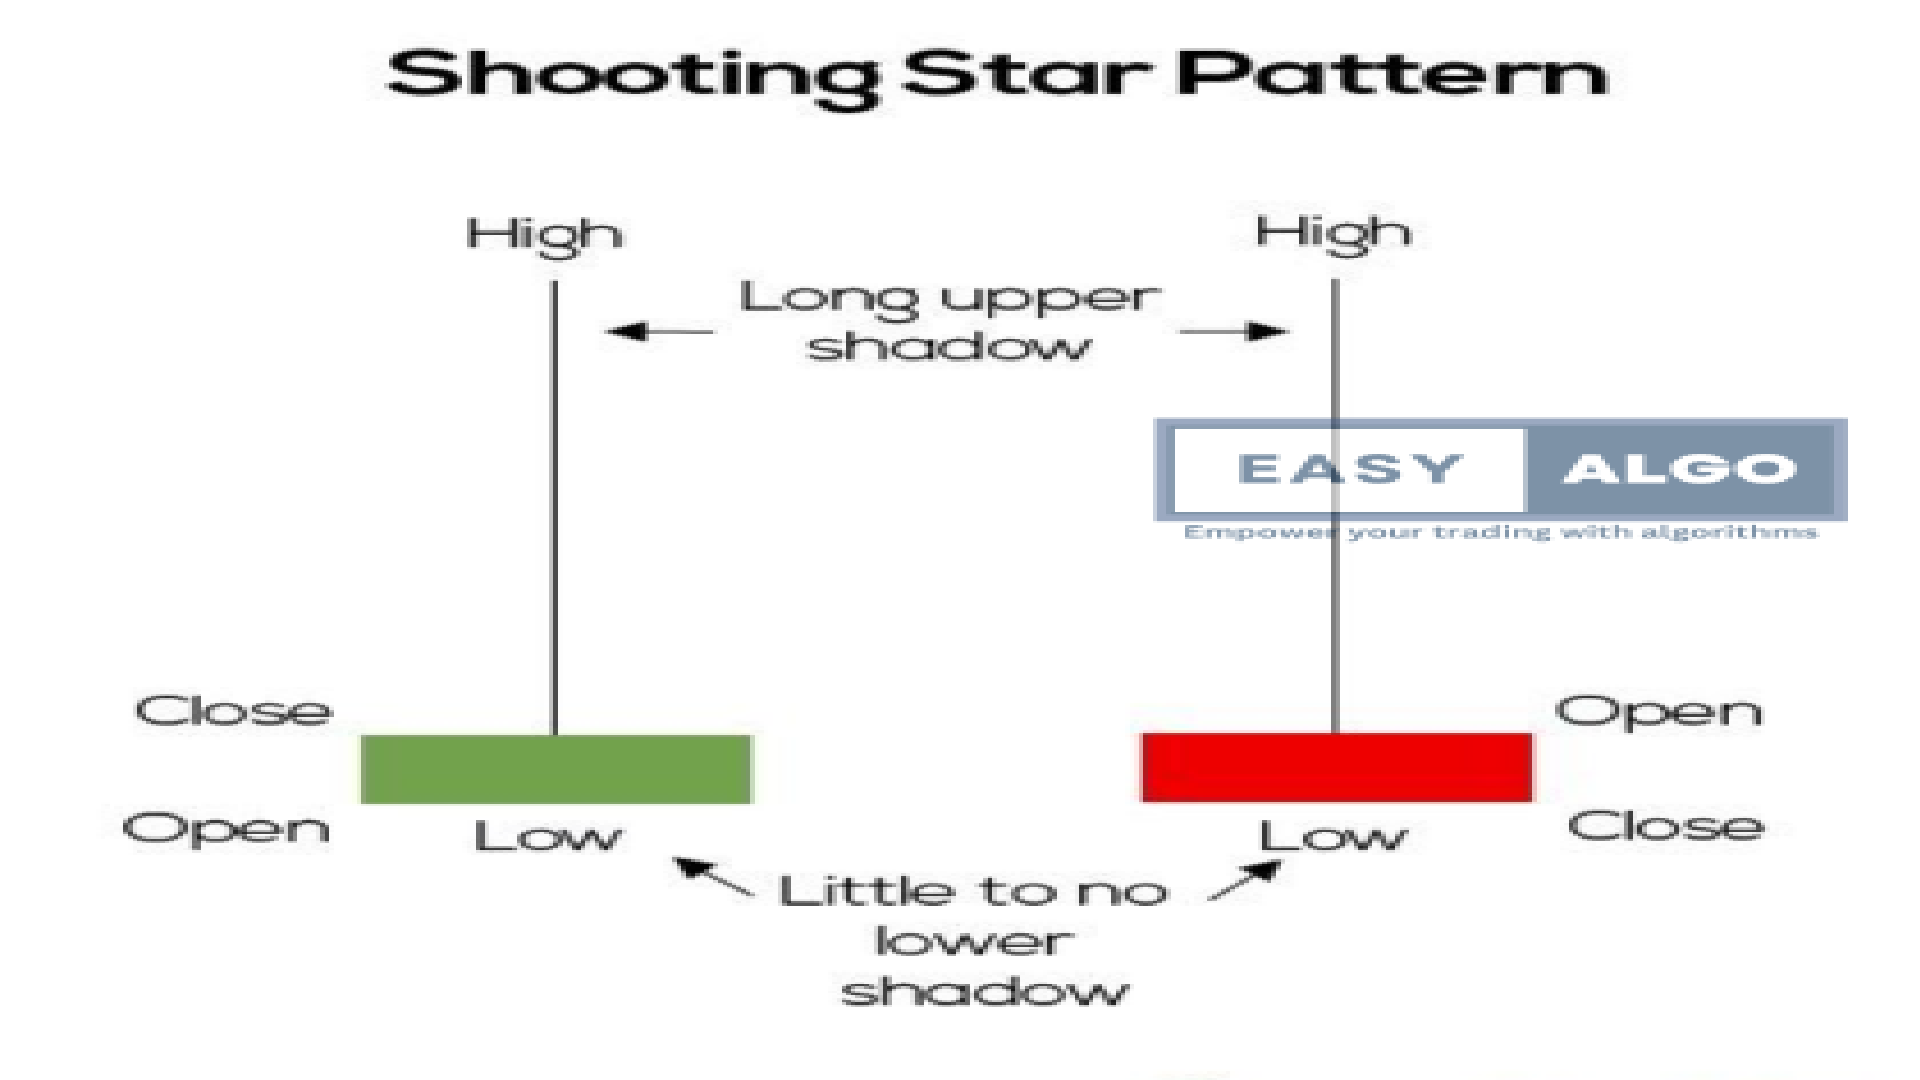
Shooting Star
Description: A bearish reversal pattern with a small body at the bottom and a long upper shadow. Usage: Indicates a potential top reversal after an uptrend.
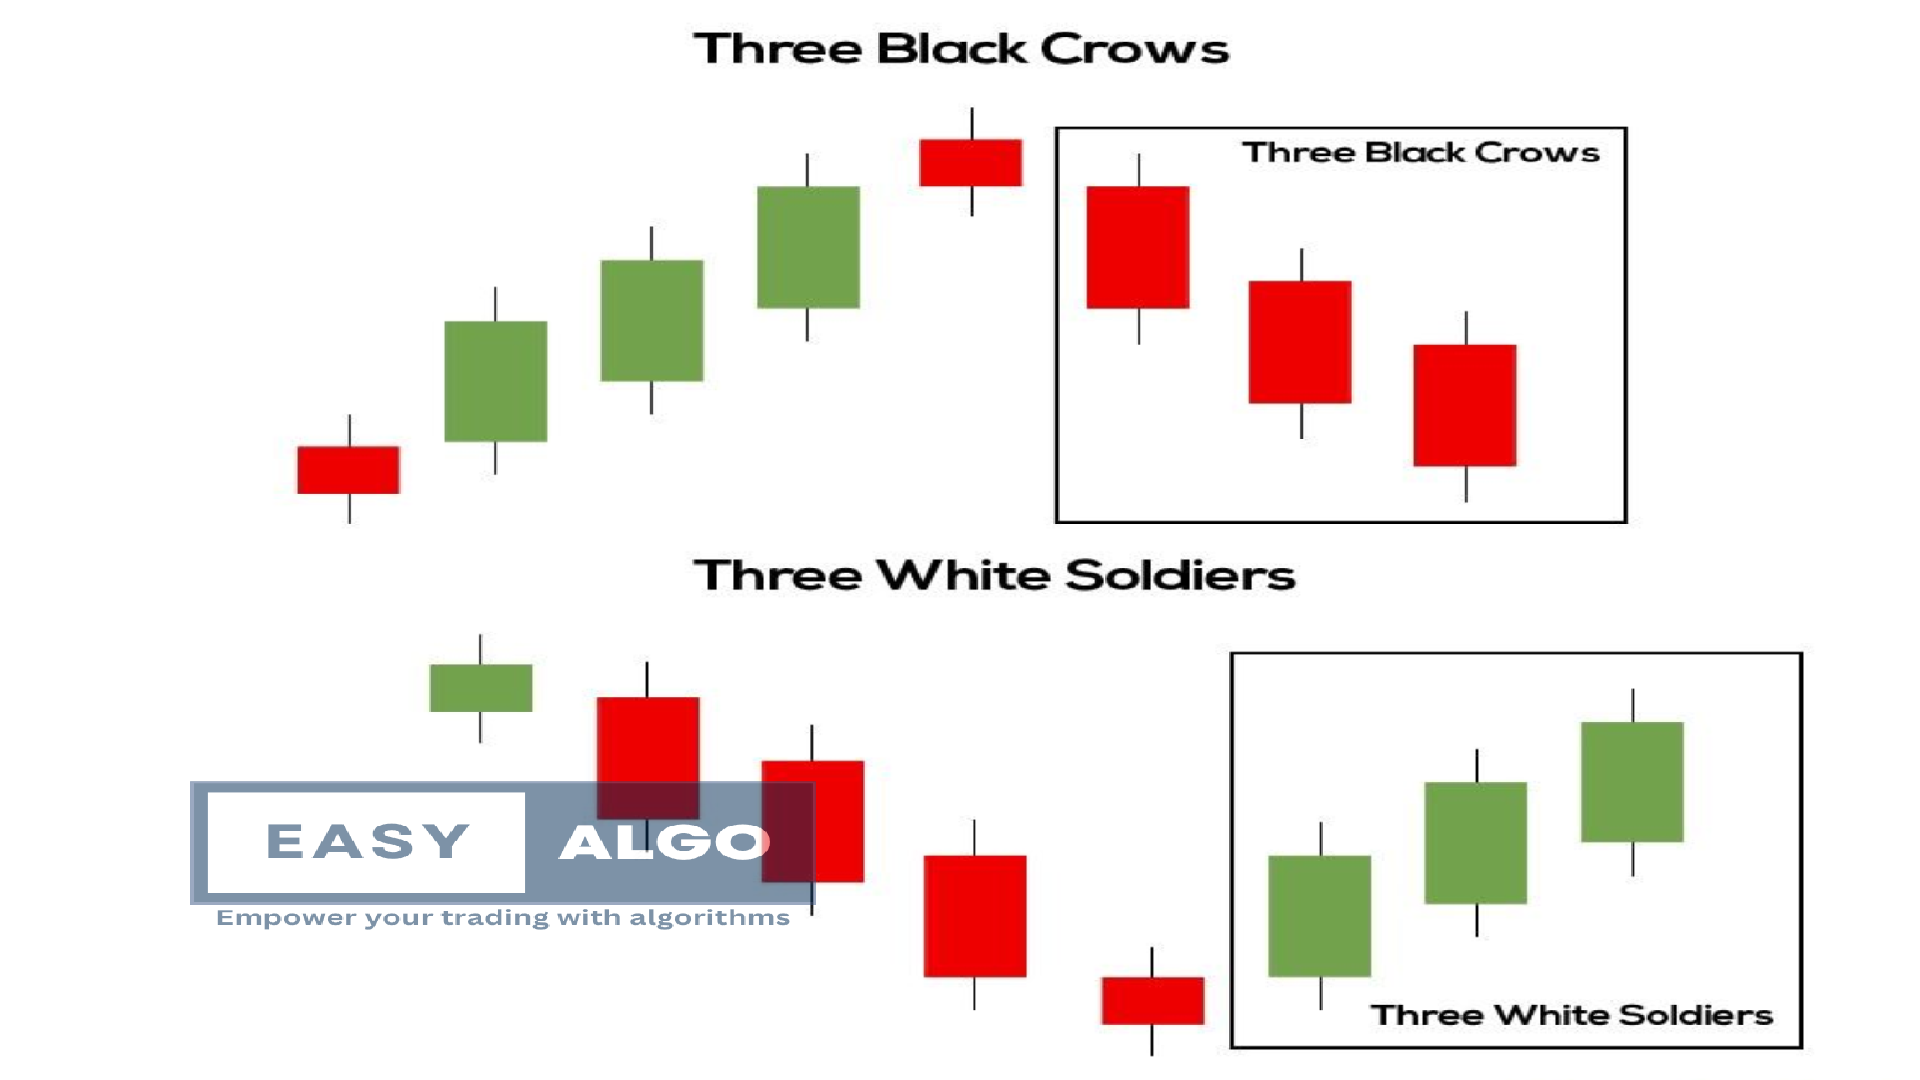
Three White Soldiers
Description: A bullish continuation pattern with three consecutive long bullish candles. Usage: Indicates strong buying pressure and the continuation of an uptrend.
Three Black Crows
Description: A bearish continuation pattern with three consecutive long bearish candles. Usage: Indicates strong selling pressure and the continuation of a downtrend.
Harmonic Patterns
Harmonic patterns are complex price formations that use Fibonacci numbers to identify potential reversal points. They are highly accurate but require precise identification and measurement.
10 Harmonic Patterns and Their Breakout Structures
Gartley Pattern
Description: A retracement and continuation pattern identified by specific Fibonacci levels. Usage: Indicates a potential reversal zone (PRZ) at the completion of the pattern.
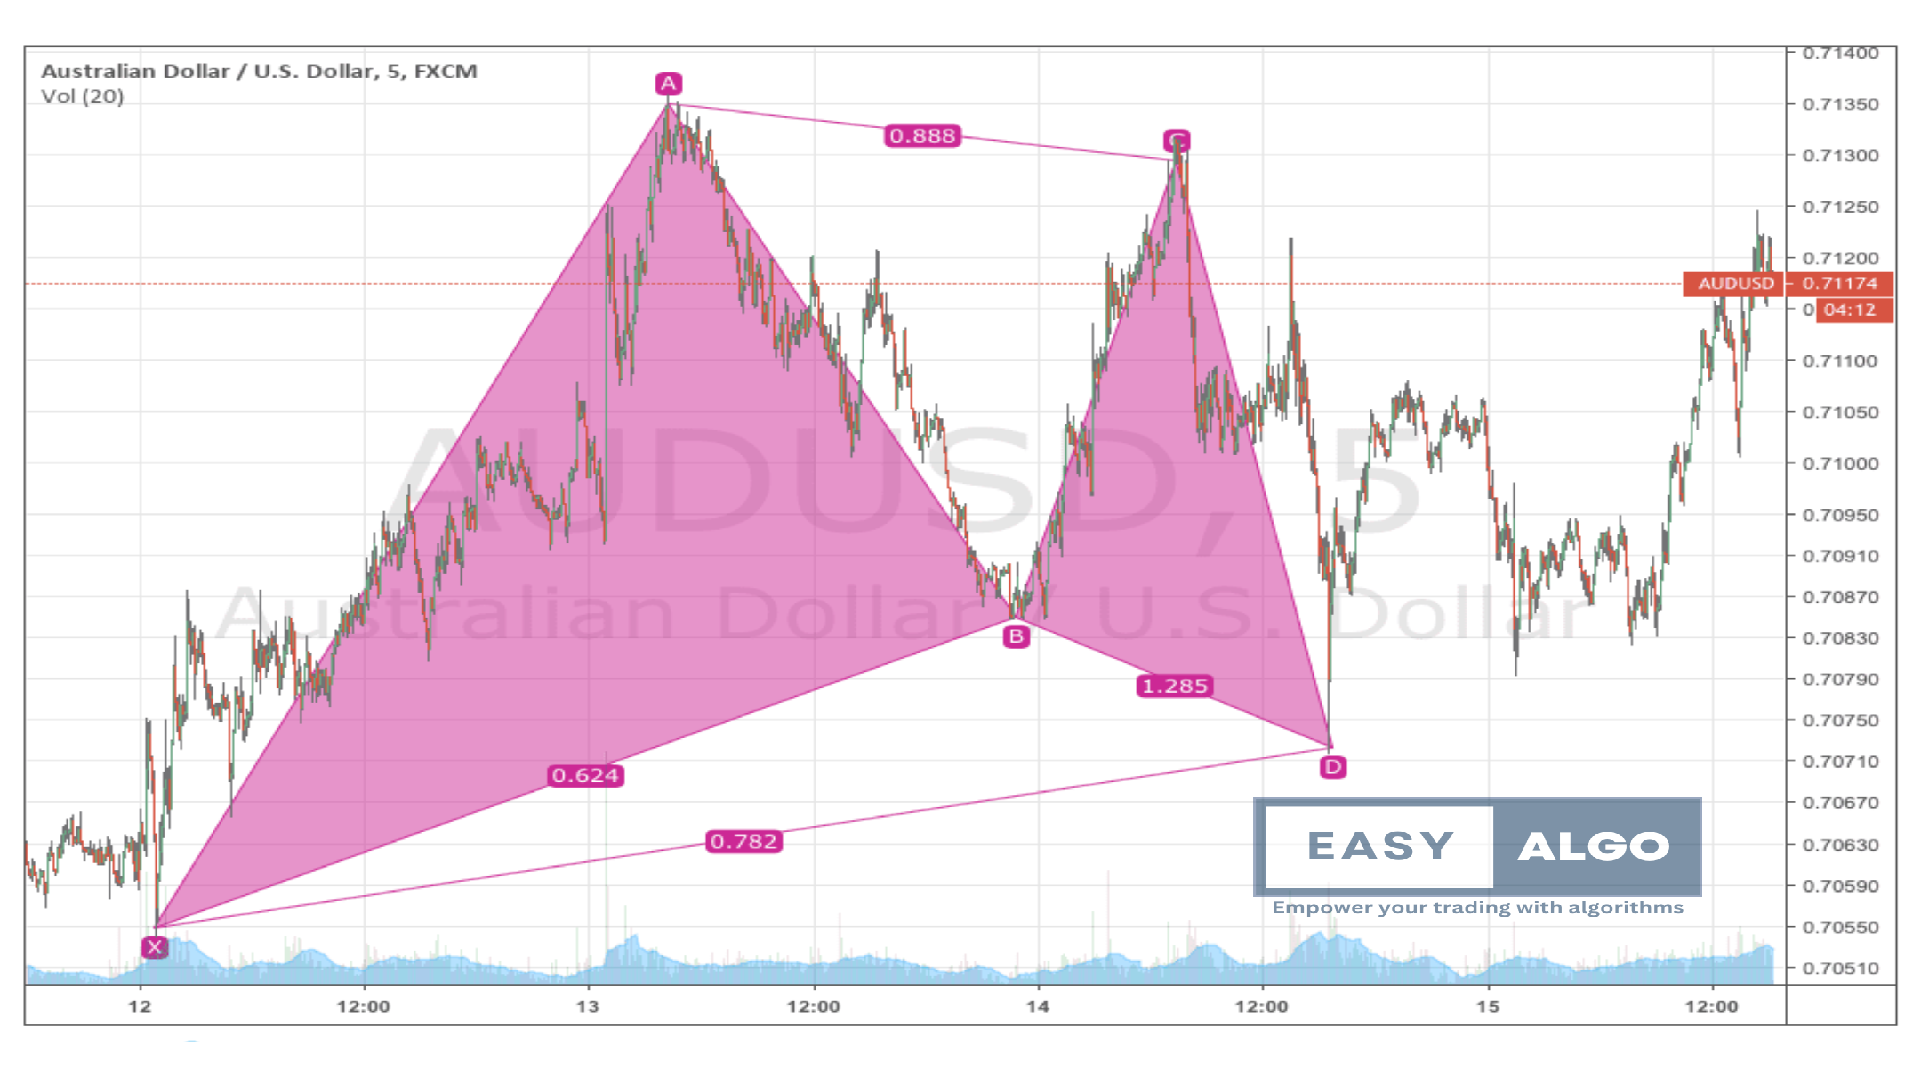
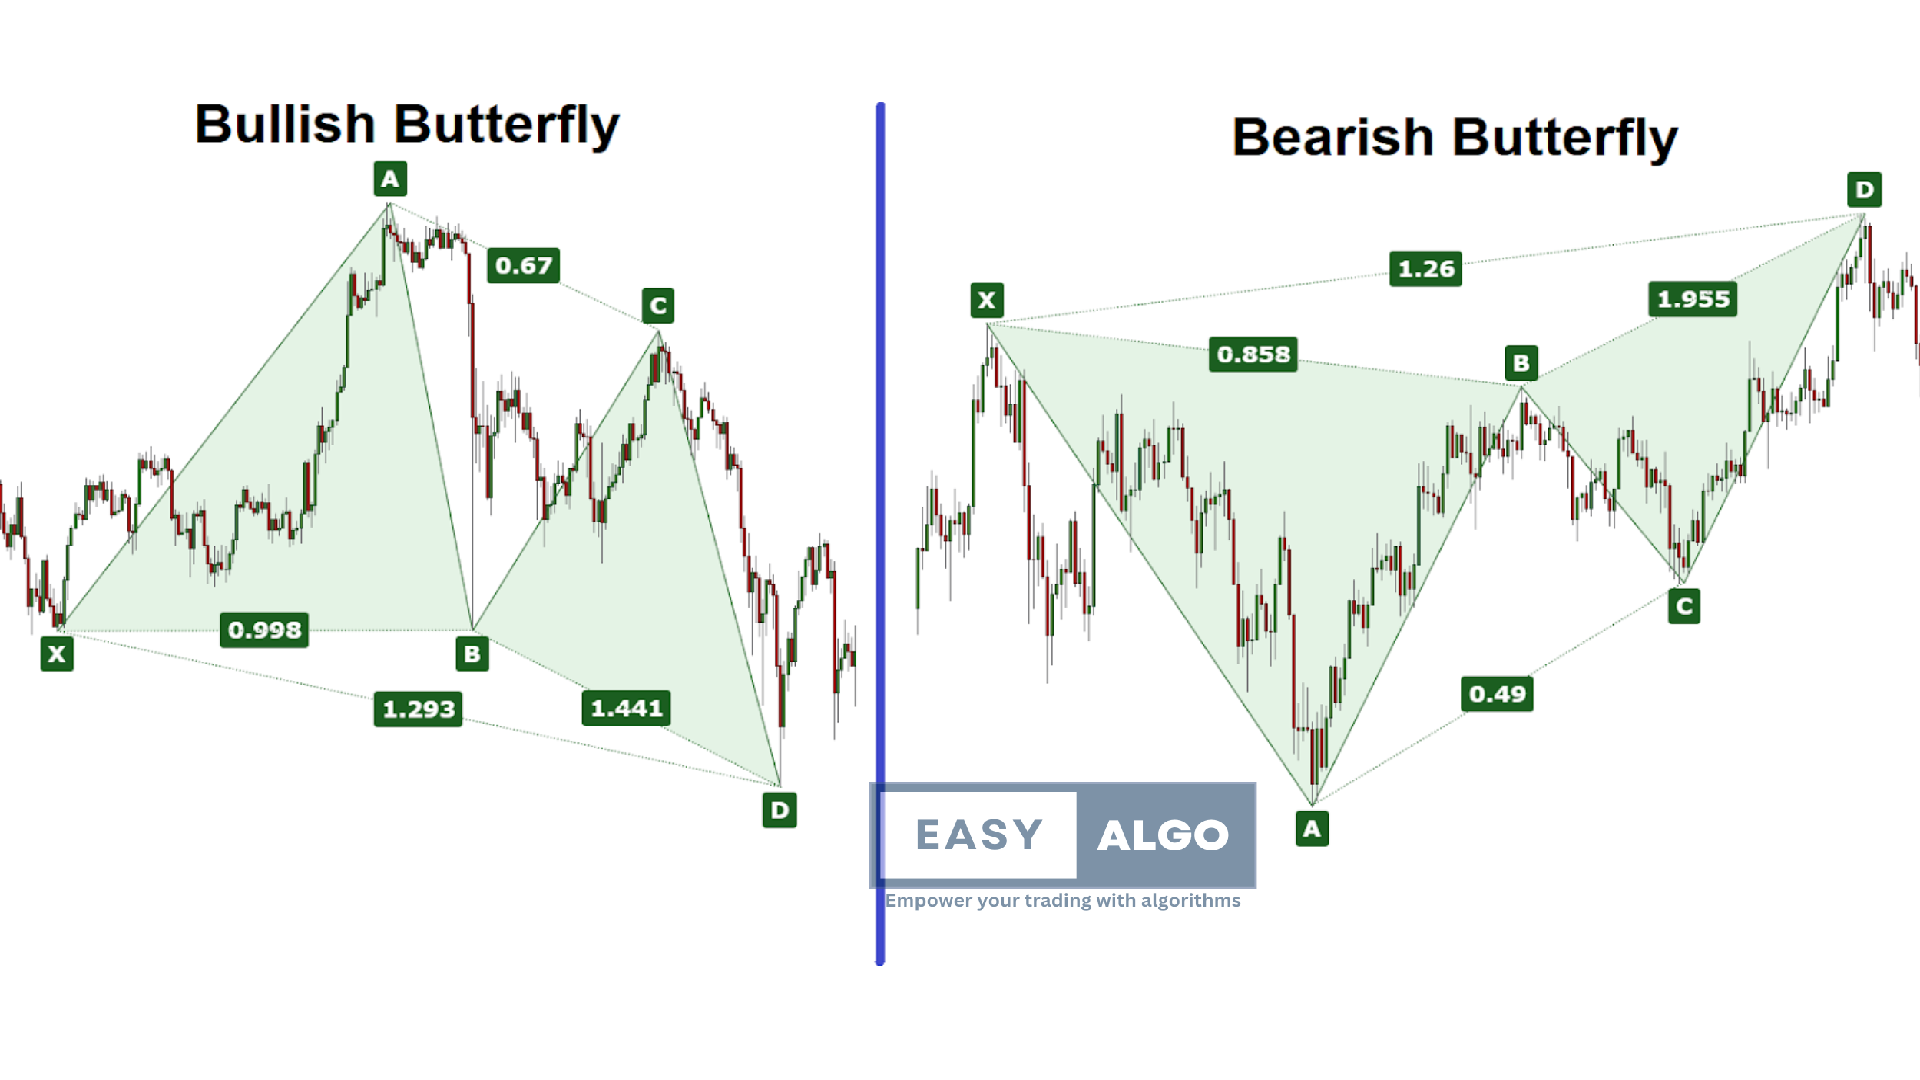
Butterfly Pattern
Description: Similar to the Gartley but with different Fibonacci measurements, indicating a deeper reversal. Usage: Used to identify the end of a trend and the start of a new trend.
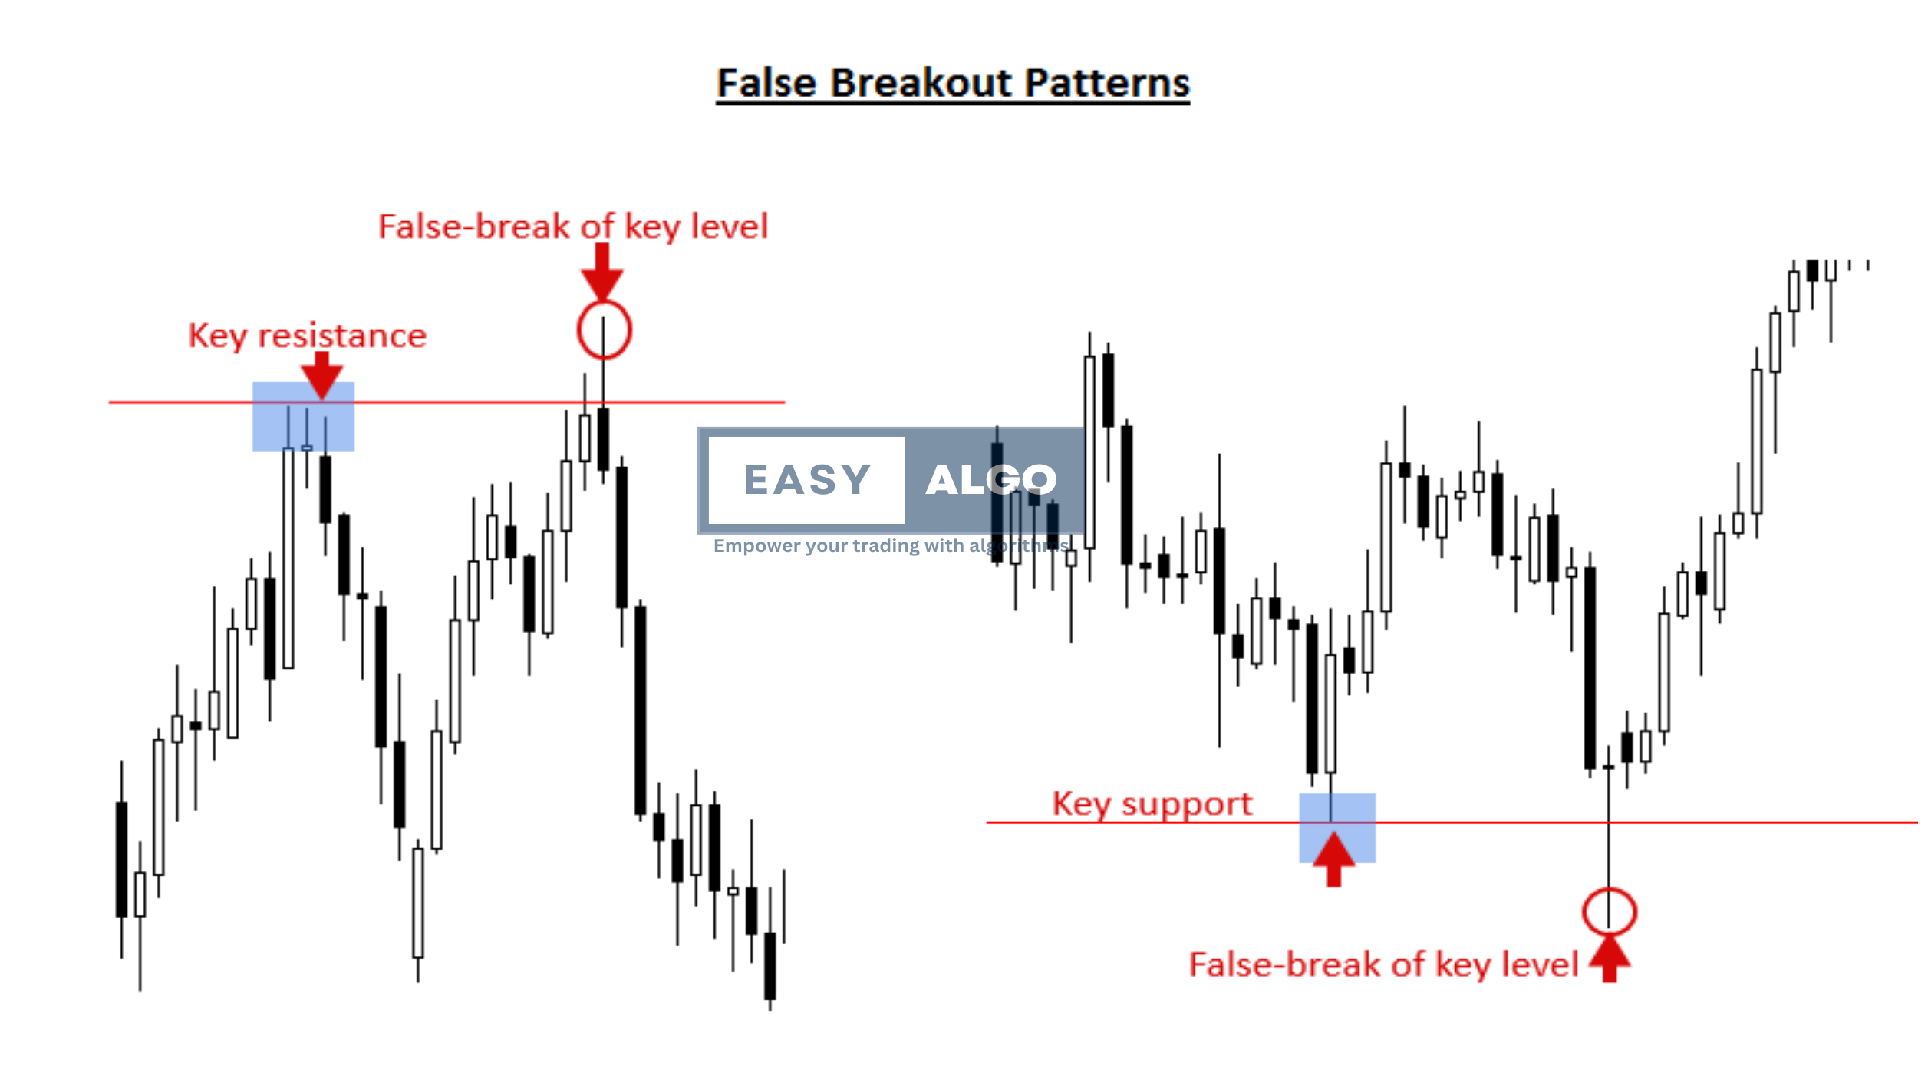
False Breakouts
Description: Occurs when the price moves beyond a support or resistance level but fails to sustain the movement. Prevention: Use volume confirmation and wait for a candle close beyond the level
Ascending Triangle Breakout
Description: A bullish continuation pattern formed by a horizontal resistance line and an upward sloping support line. Usage: Indicates potential upward movement upon breakout.
.png)
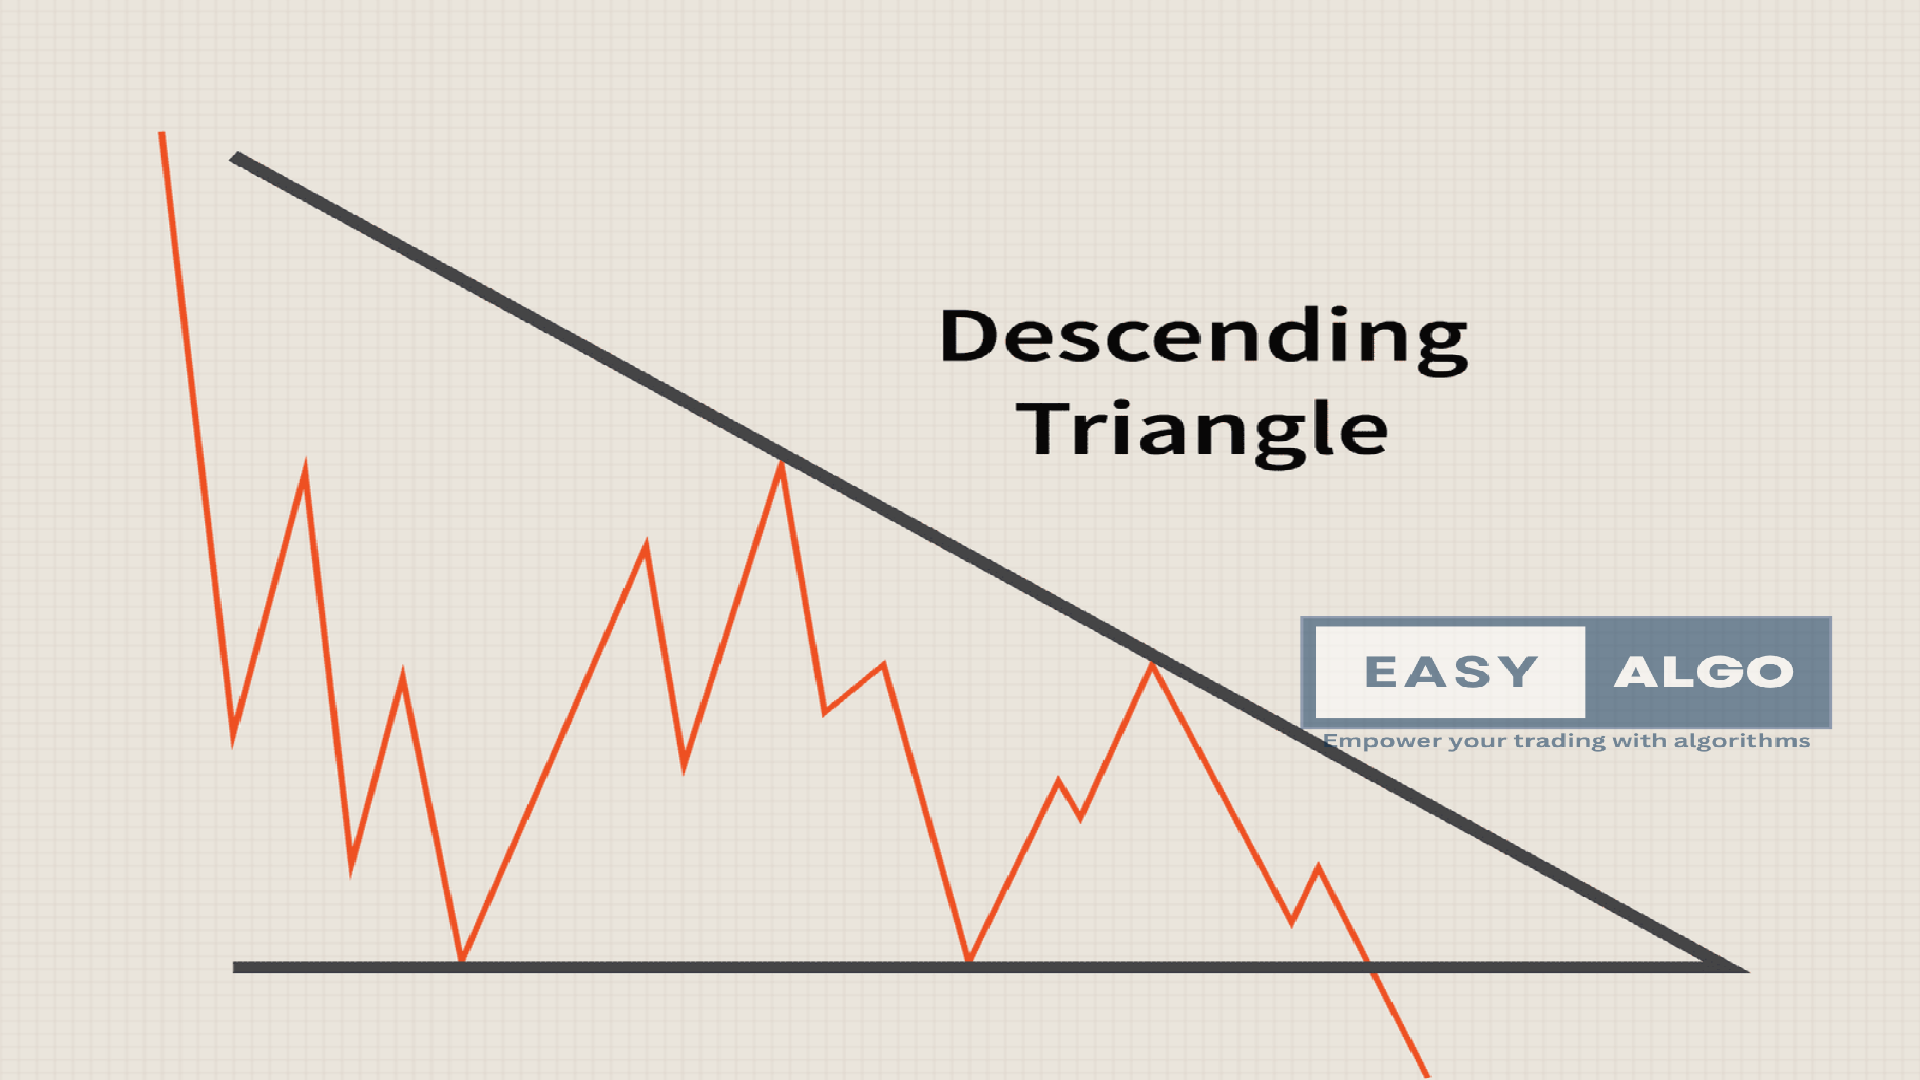
Descending Triangle Breakout
Description: A bearish continuation pattern formed by a horizontal support line and a downward sloping resistance line. Usage: Indicates potential downward movement upon breakout.
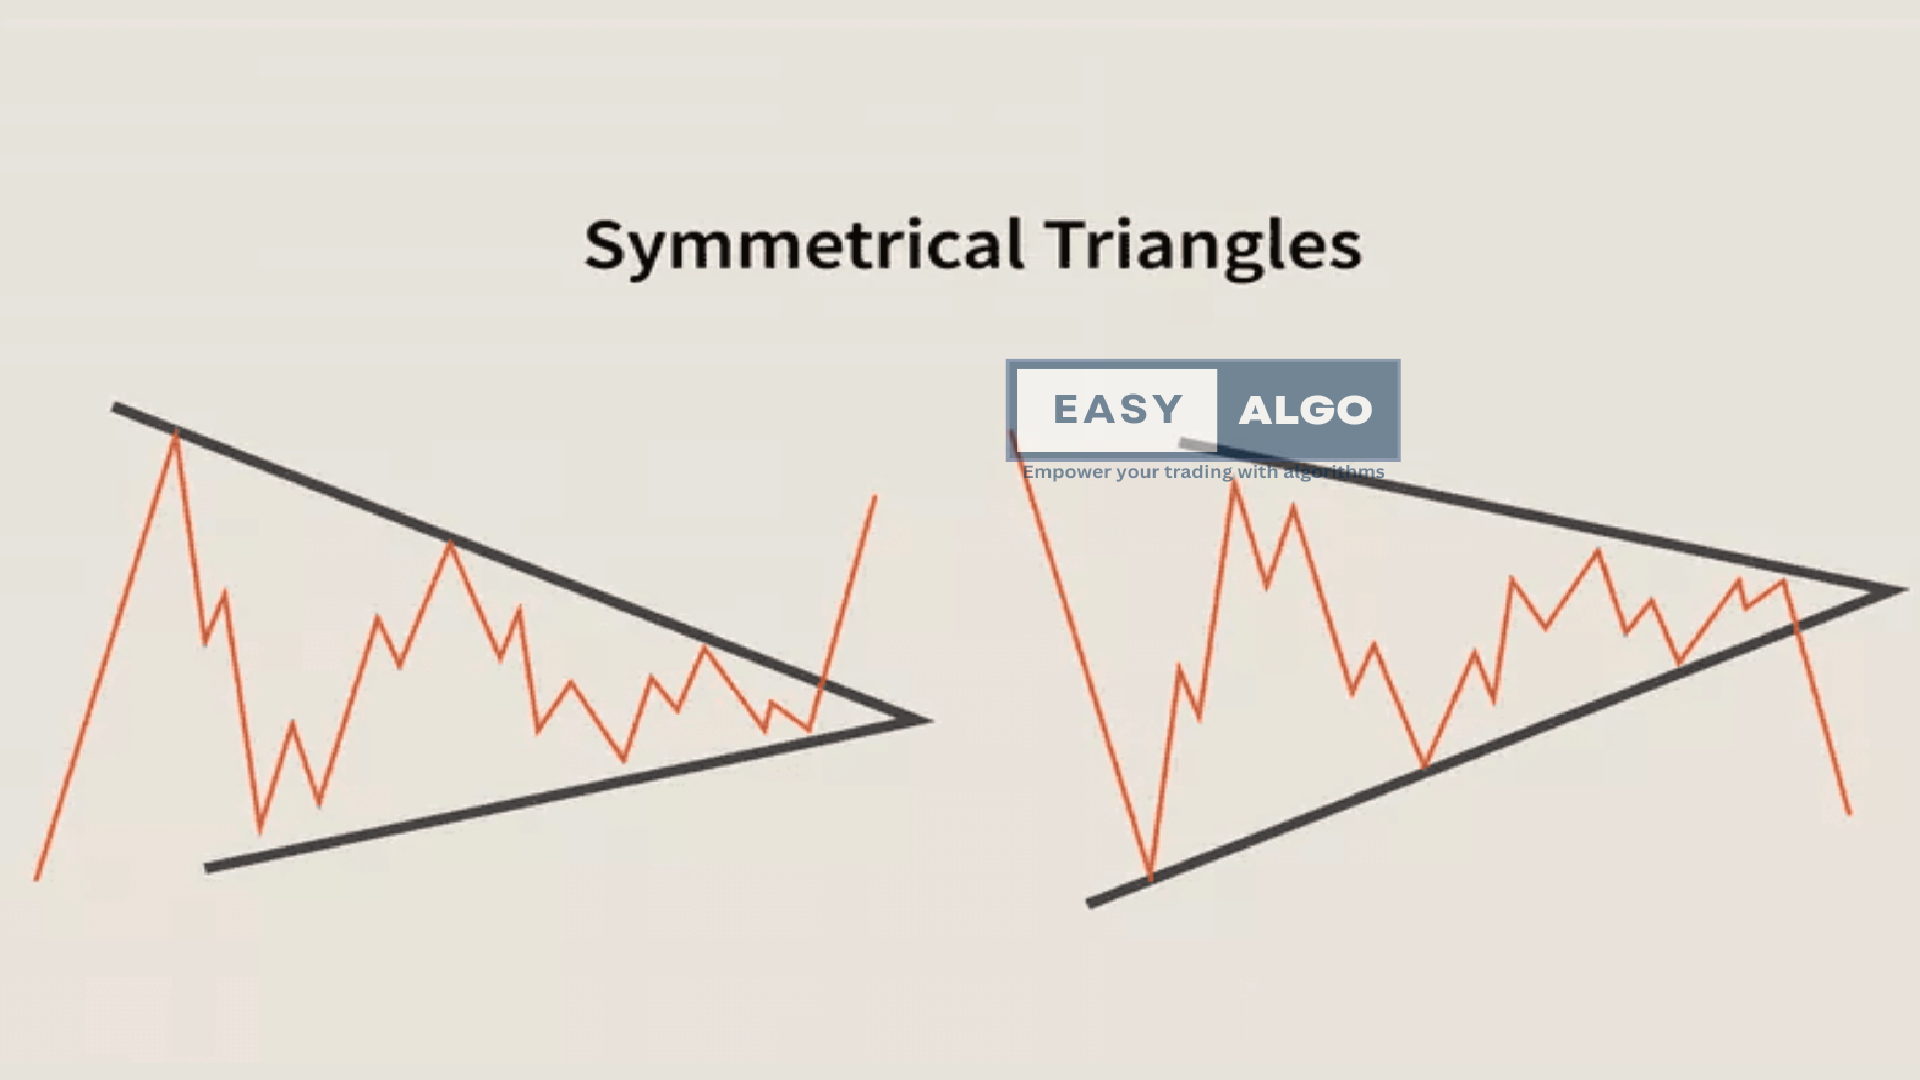
Symmetrical Triangle Breakout
Description: A pattern formed by two converging trend lines with similar slopes, indicating a period of consolidation. Usage: Breakout direction indicates the next trend.
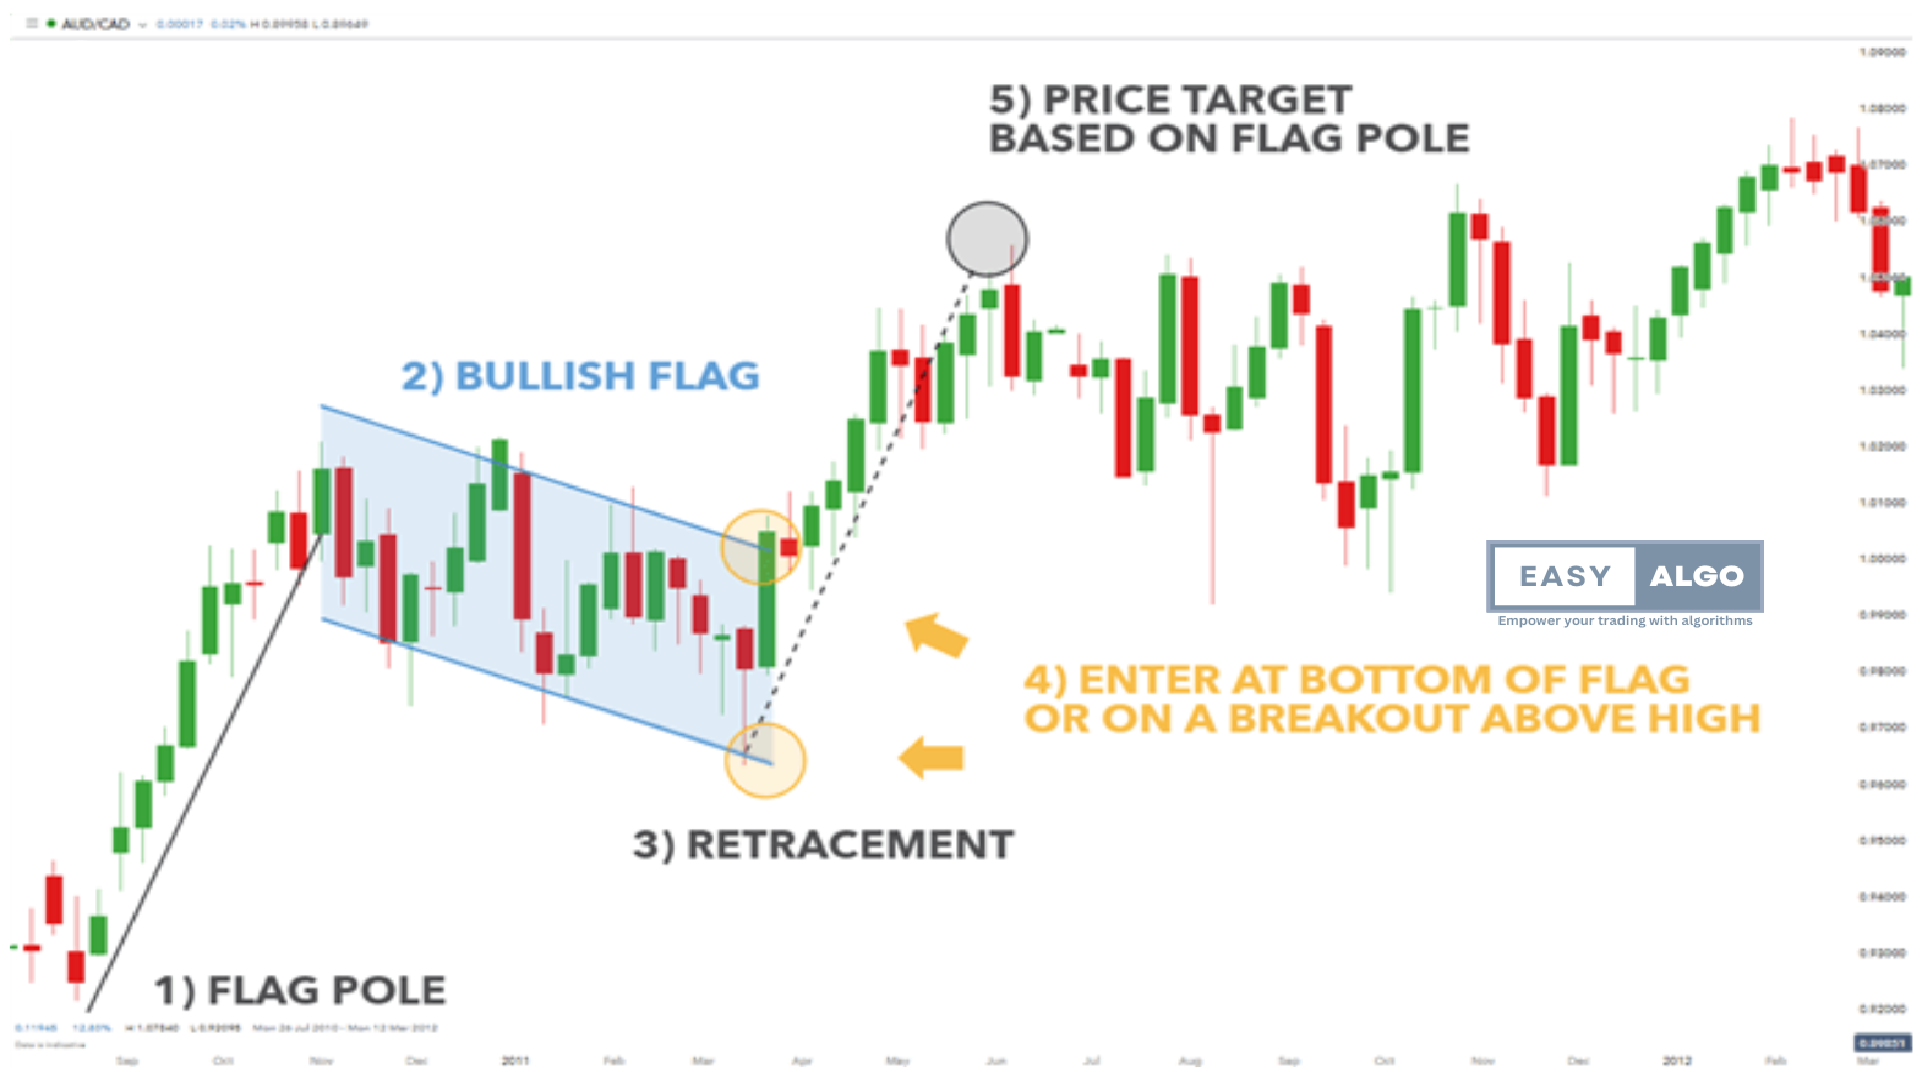
Flag Pattern Breakout
Description: A short-term continuation pattern that resembles a flag on a pole. Usage: Indicates potential continuation of the prevailing trend.
Ignoring Timeframes
Description: Not considering different timeframes can lead to false signals. Prevention: Analyze breakouts across multiple timeframes.
Failing to Adapt Strategies
Description: Sticking to a single strategy in all market conditions. Prevention: Adapt strategies based on current market conditions.
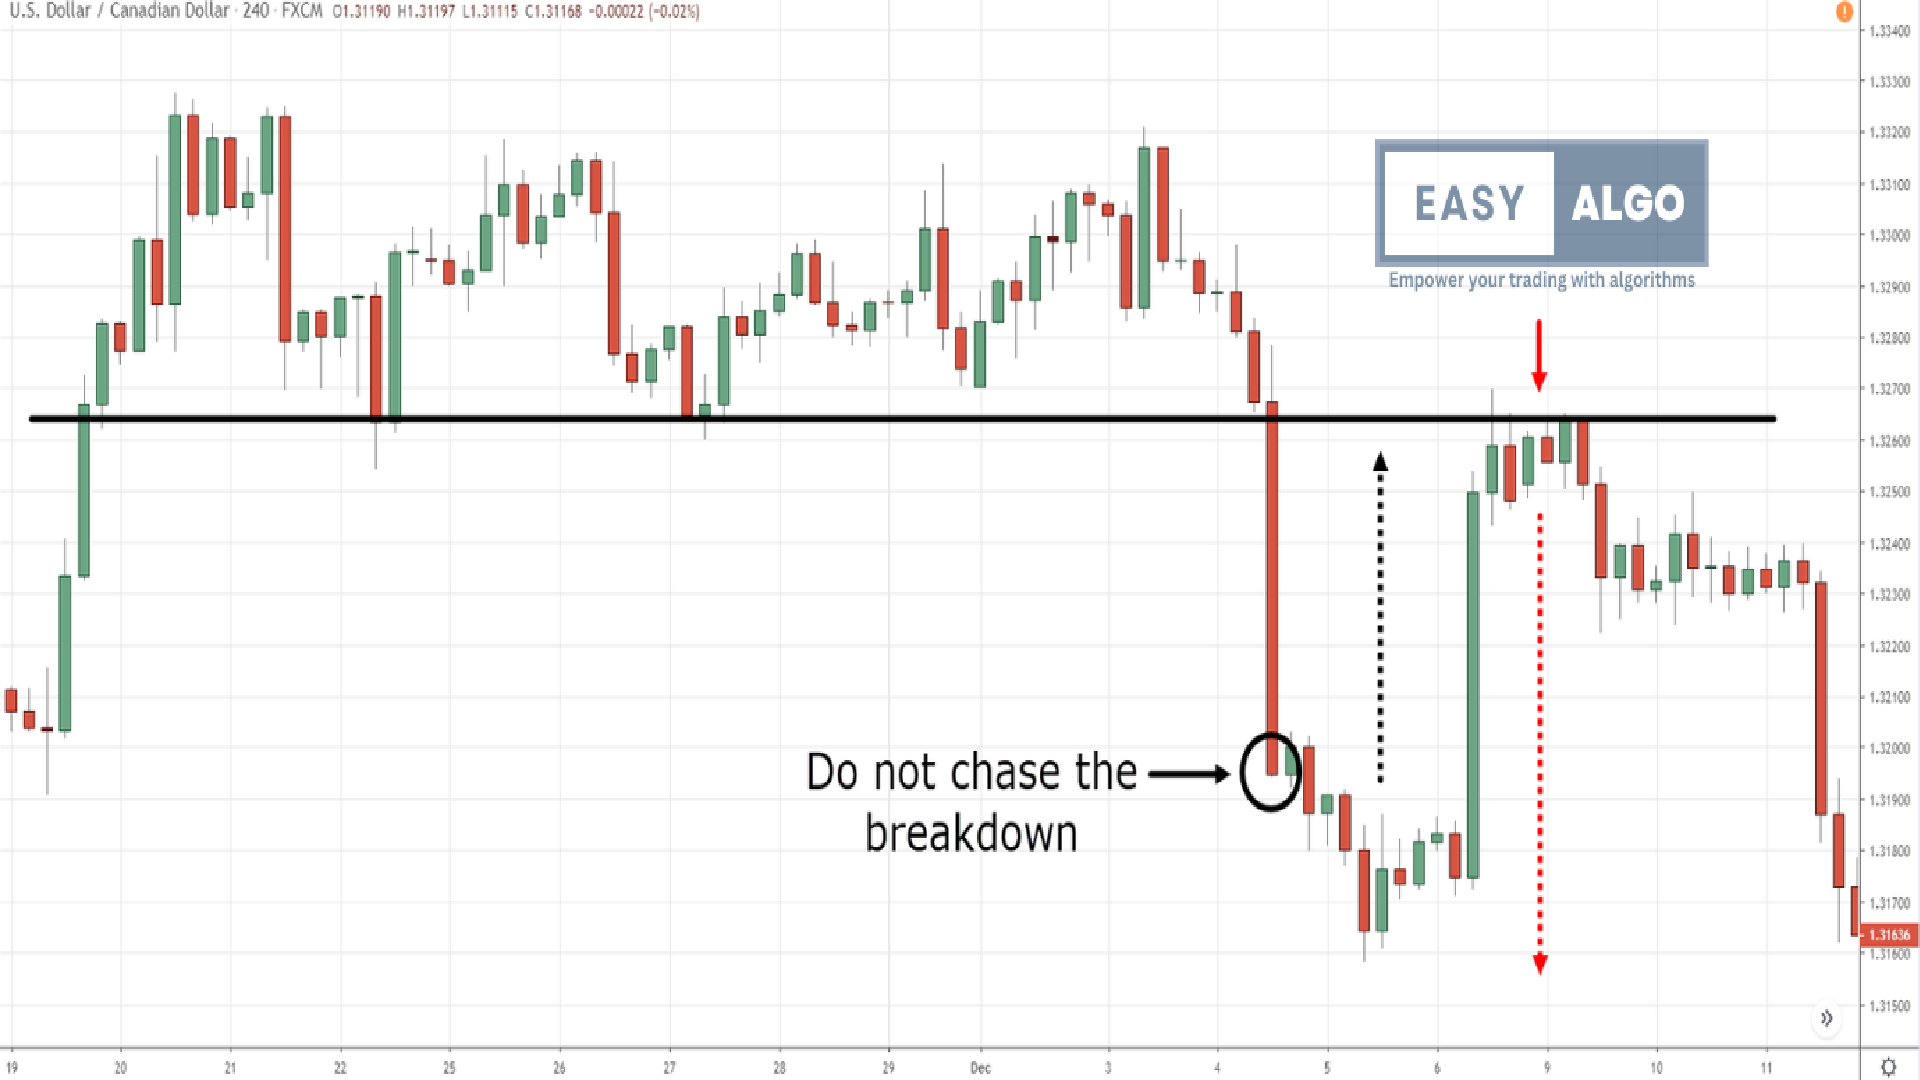
Chasing Breakouts
Description: Entering trades late after the breakout has already occurred. Prevention: Be patient and plan entries in advance.
Demand/Supply Zones
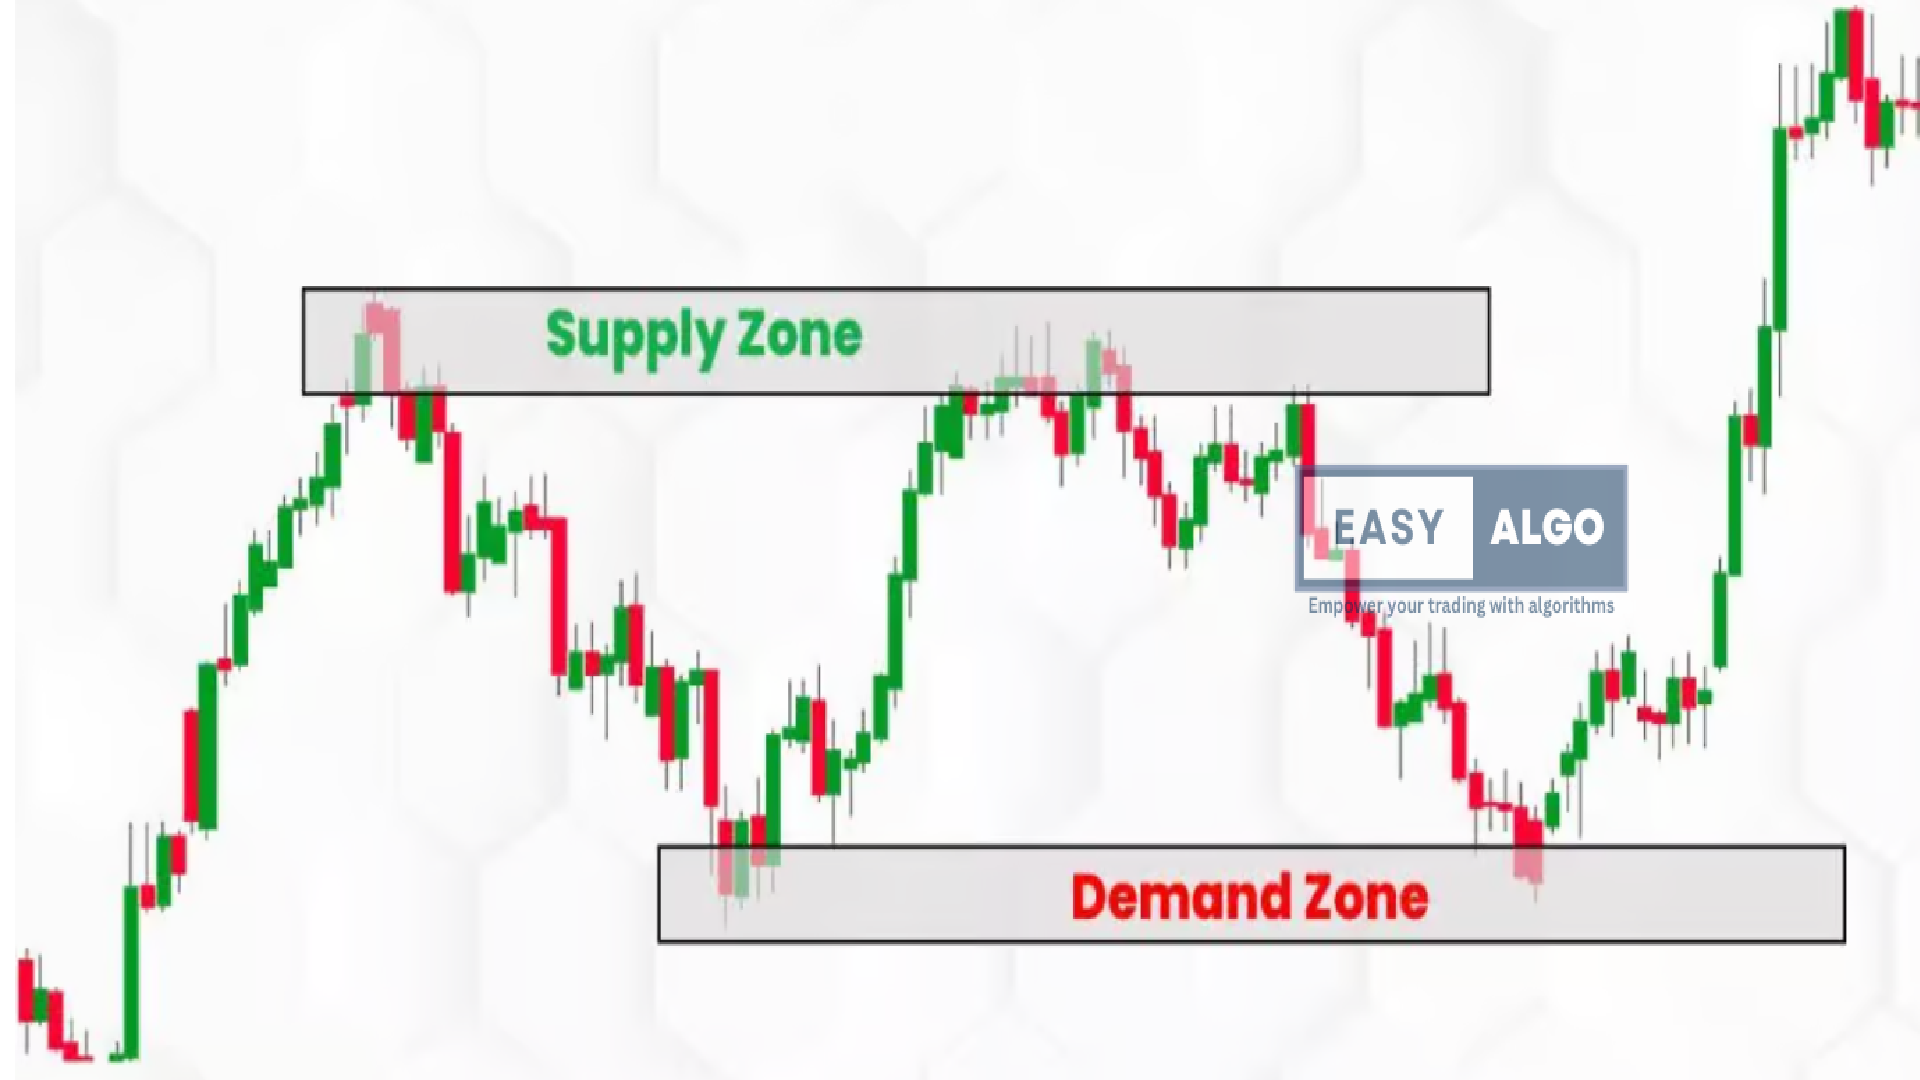
Demand and supply zones are price levels where significant buying or selling activity has occurred. These zones can act as support or resistance levels.
How to Identify and Mark Demand/Supply Zones
- Identify Zones: Look for price areas where sharp reversals have occurred.
- Mark Zones: Draw rectangles to highlight these areas on your chart.
- Usage: Use these zones to predict future price movements and set entry/exit points.
Pros
- High accuracy in identifying potential reversal points.
- Easy to identify on charts.
Cons
- May not always hold, especially in volatile markets.
- Requires confirmation from other indicators for reliability.
By understanding these technical analysis tools, traders can better predict market movements and make more informed trading decisions.
