Common Technical Indicators in Trading: How to Use Them, Pros, and Cons
Technical indicators are mathematical calculations based on the price, volume, or open interest of a security or contract. Traders use them to analyze price movements and forecast future price trends. Here, we will explore some of the most common technical indicators, how to use them, and their pros and cons.
1. Moving Averages (MA)
Overview
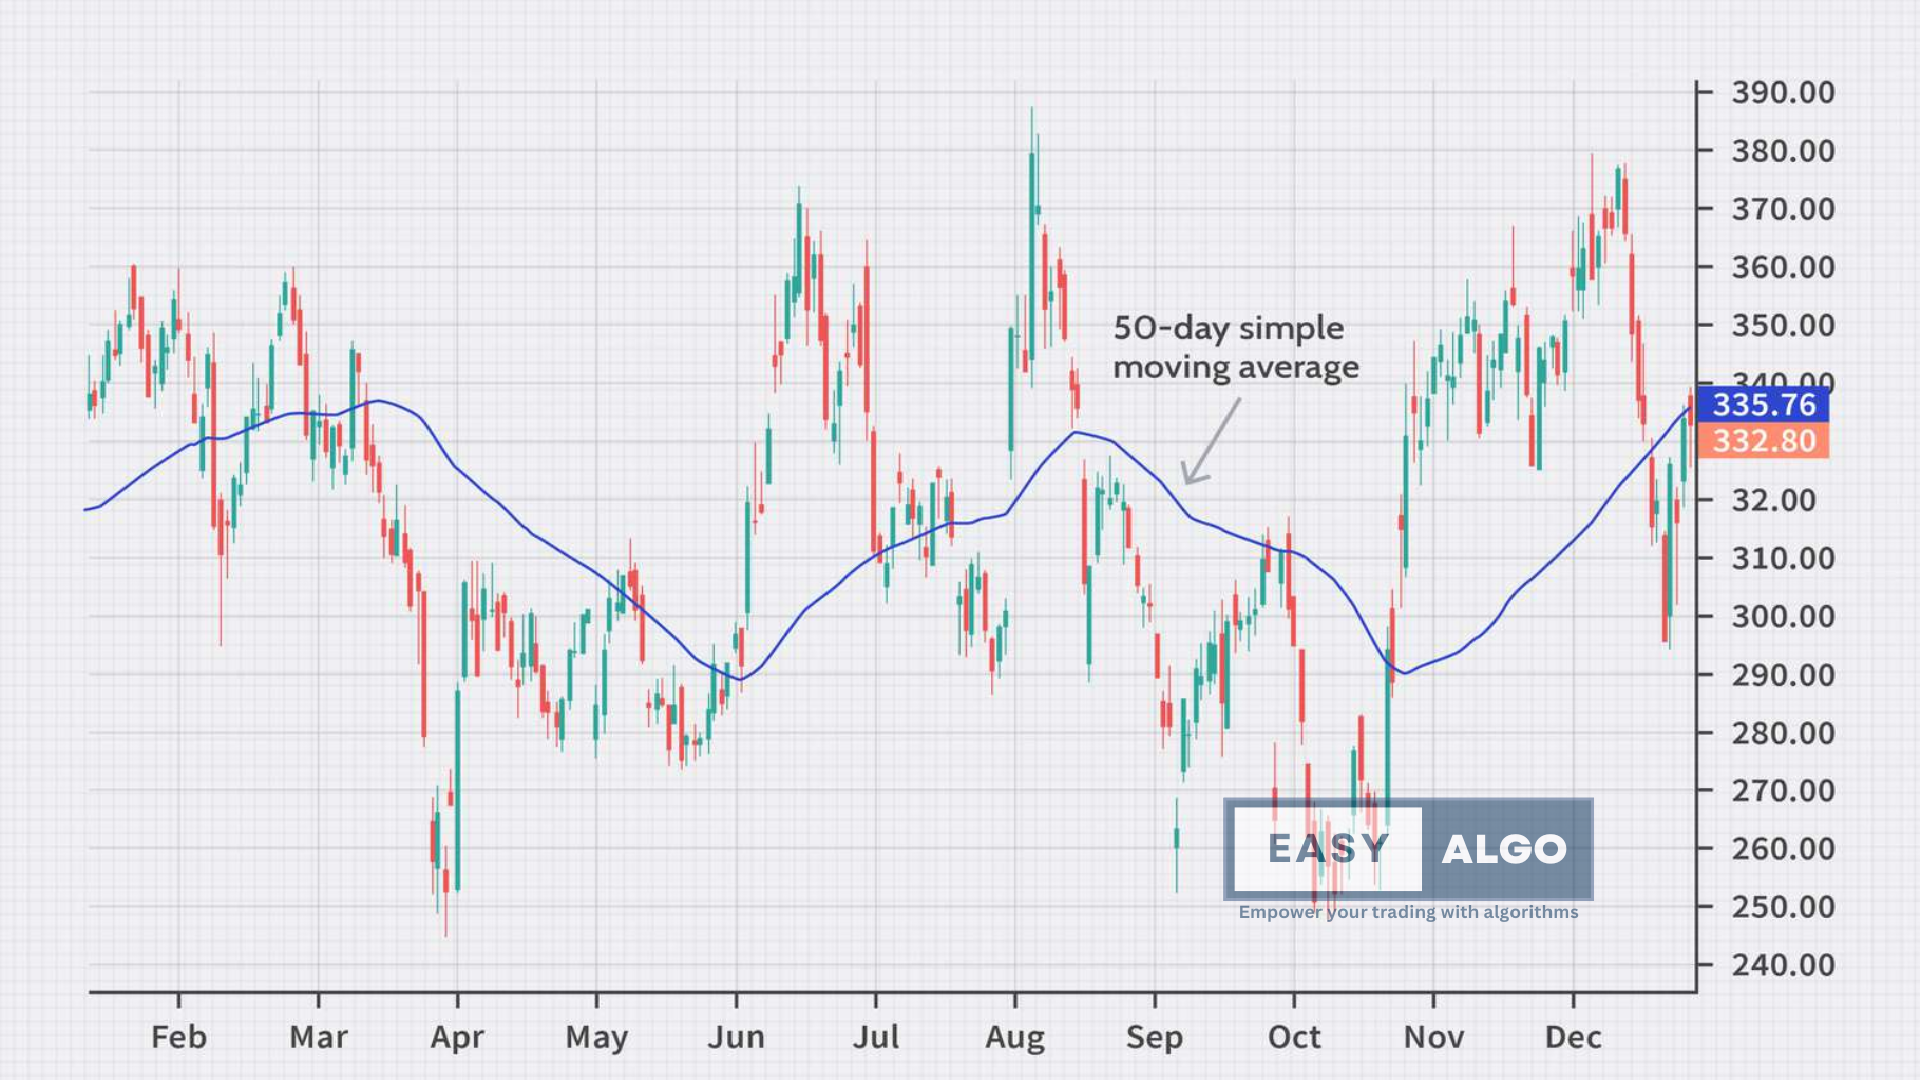
Moving averages smooth out price data to create a single flowing line that traders use to identify the direction of the trend. The two most popular types are the Simple Moving Average (SMA) and the Exponential Moving Average (EMA).
How to Use
- SMA: Calculated by averaging a set number of past closing prices. For instance, a 50-day SMA sums the last 50 days' closing prices and divides by 50.
- EMA: Gives more weight to recent prices, making it more responsive to new information.
Pros
- Trend Identification: Helps identify and confirm trends, offering insights into the direction of the market.
- Support and Resistance: Acts as dynamic support or resistance levels, where prices often respect moving averages.
Cons
- Lagging Indicator: Reacts slower to recent price changes, potentially causing delays in signal generation during volatile periods.
- Whipsaws: Can produce false signals in a sideways or choppy market.

2. Relative Strength Index (RSI)
Overview
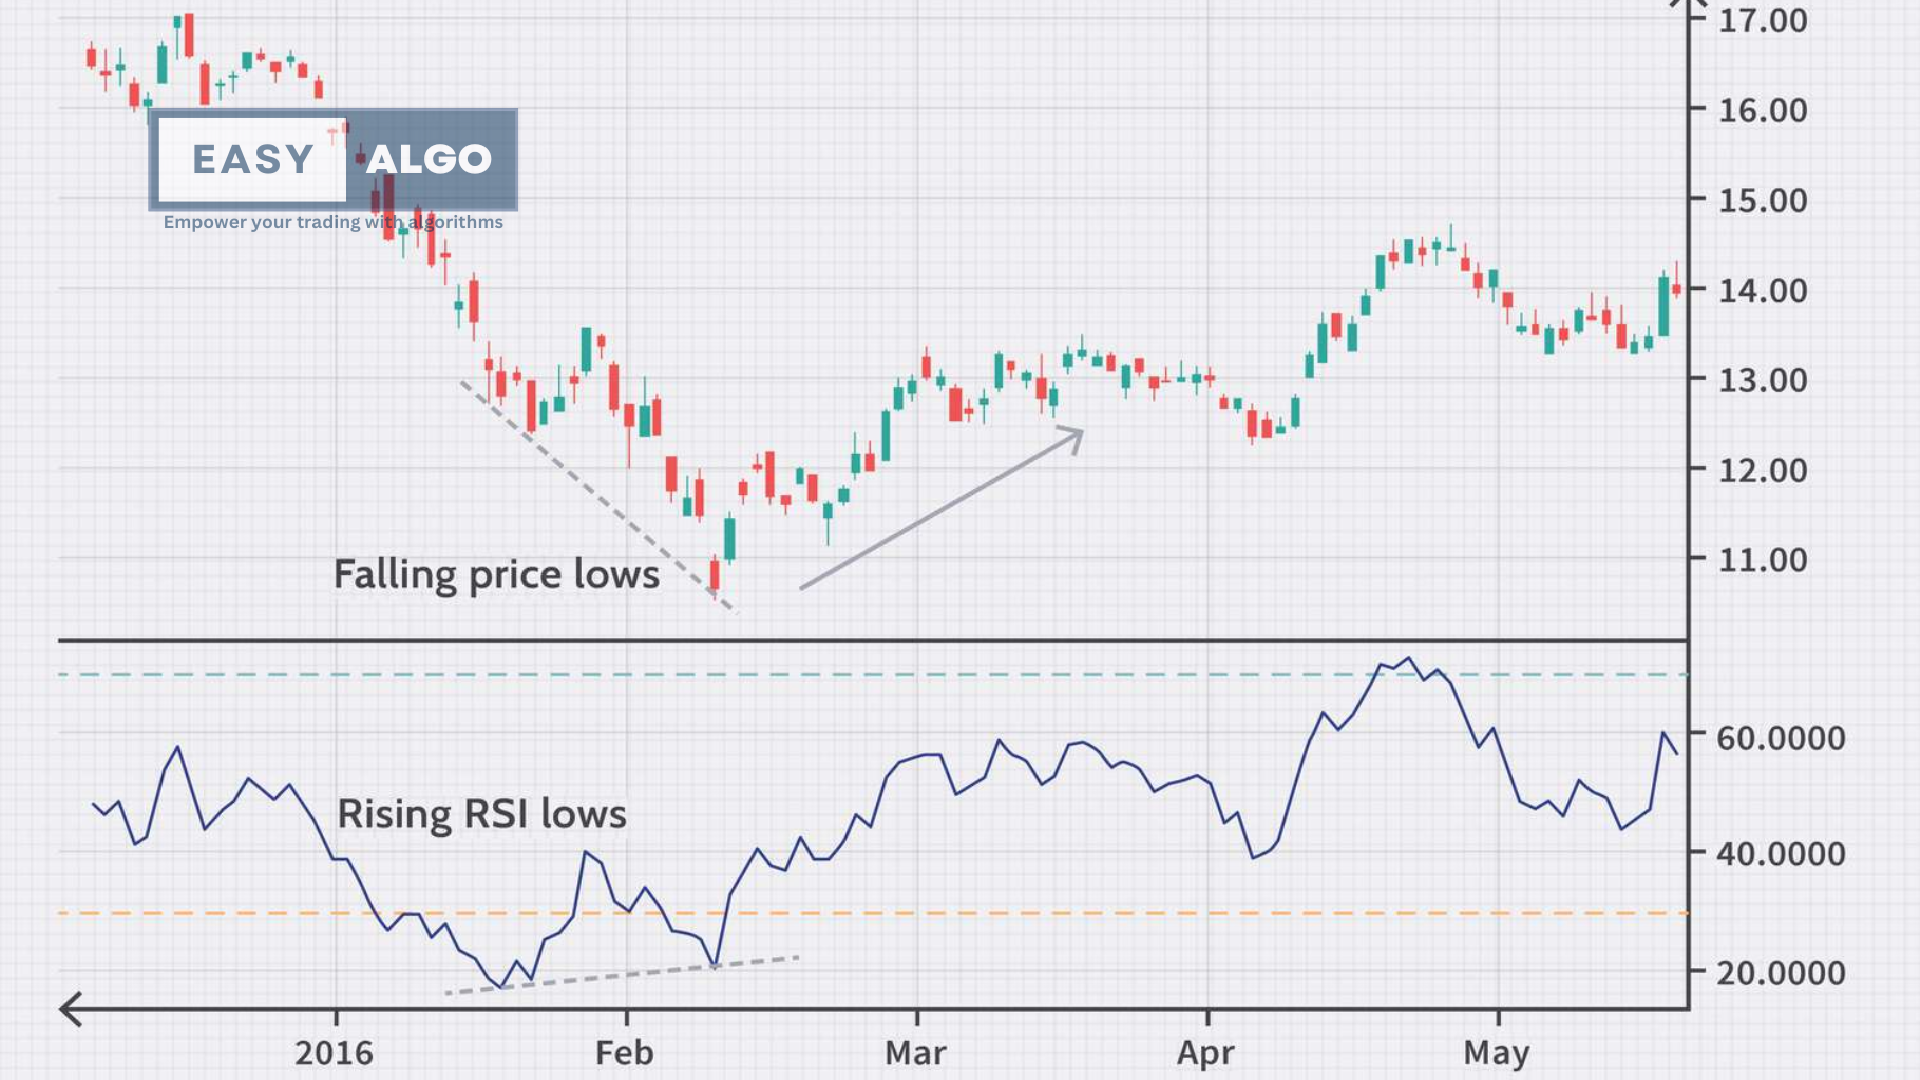
The RSI is a momentum oscillator that measures the speed and change of price movements. It ranges from 0 to 100.
How to Use
- Overbought/Oversold Levels: RSI above 70 indicates overbought; below 30, oversold. Look for reversals when RSI reaches extreme levels.
- Divergence: Identify divergences between RSI and price movements for potential trend shifts.
Pros
- Momentum Identification: Highlights momentum shifts and potential trend reversals in price movements.
- Divergence Signals: Offers early warning signals of possible trend reversals through RSI divergences.
Cons
- False Signals: Generates false signals in choppy or range-bound markets, leading to potential losses.
- Overbought/Oversold Extremes: RSI can remain in overbought or oversold conditions for extended periods during strong trends.

3. Moving Average Convergence Divergence (MACD)
Overview
MACD is a trend-following momentum indicator that shows the relationship between two moving averages of a security’s price.
How to Use
- Crossovers: Signal potential trend changes when the MACD Line crosses above or below the Signal Line.
- Divergence: Identify divergences between MACD and price movements for potential trend shifts.
Pros
- Trend Confirmation: Confirms trends and potential reversals, providing valuable insights into market direction.
- Momentum Measurement: Gauges the strength and direction of price momentum, aiding in decision-making.
Cons
- Lagging Indicator: Reacts slower to recent price changes, potentially causing delays in signal generation during volatile periods.
- False Signals: Generates false signals in choppy markets, leading to potential losses if not used with other indicators.
4. Bollinger Bands
Overview
Bollinger Bands consist of a middle band (SMA) and two outer bands (standard deviations). They measure market volatility.
How to Use
- Price Breakouts: Price moves outside the bands signal potential breakouts and trend continuation or reversal.
- Volatility Analysis: Narrowing bands indicate low volatility, while widening bands suggest increased volatility.
Pros
- Volatility Insights: Provides valuable information on market volatility, aiding in decision-making.
- Breakout Signals: Identifies potential breakout opportunities when prices move outside the bands.
Cons
- False Signals: Generates false breakout signals during low volatility periods, leading to potential losses.
- Limited Trend Information: Focuses primarily on volatility, providing limited information on overall trend direction.
5. Stochastic Oscillator
Overview
The Stochastic Oscillator compares a particular closing price of a security to a range of its prices over a certain period.
How to Use
- Overbought/Oversold Levels: Readings above 80 are considered overbought, and below 20 are considered oversold.
- Crossovers: Bullish when the %K line crosses above the %D line and bearish when it crosses below.
Pros
- Trend Reversals: Can identify potential trend reversals.
- Momentum Indicator: Helps in gauging the momentum of the price movement.
Cons
- False Signals: Can give false signals in strong trends.
- Requires Confirmation: Often needs confirmation from other indicators to avoid misleading signals.
Support and resistance are fundamental concepts in technical analysis, used by traders to make informed decisions about market entry and exit points. These levels are pivotal in understanding market psychology and price movement.
Support
Support is a price level at which a downtrend can be expected to pause due to a concentration of demand. As the price of an asset drops, it reaches a point where buyers are willing to step in and purchase, creating a "floor" that supports the price from falling further.
What Support Tells Us
- Buying Interest: Indicates areas where buyers have historically entered the market, preventing further declines.
- Potential Entry Point: Traders often look for buying opportunities at support levels, anticipating that the price will bounce back.
- Market Sentiment: Strong support levels suggest strong buying sentiment and confidence in the asset at that price point.
Resistance
Resistance is a price level at which an uptrend can be expected to pause due to a concentration of selling. As the price of an asset rises, it reaches a point where sellers are willing to sell, creating a "ceiling" that resists further upward movement.
What Resistance Tells Us
- Selling Interest: Indicates areas where sellers have historically entered the market, preventing further price increases.
- Potential Exit Point: Traders often look for selling opportunities at resistance levels, anticipating that the price will drop.
- Market Sentiment: Strong resistance levels suggest strong selling sentiment and lack of confidence in the asset at higher price points.
Role in Market Analysis
Trend Identification
- Support in Uptrends: In an uptrend, support levels tend to form at higher prices, indicating a strong buying interest that drives the market upwards.
- Resistance in Downtrends: In a downtrend, resistance levels tend to form at lower prices, indicating strong selling pressure that drives the market downwards.
Reversals
- Breakthroughs: When the price breaks through a support or resistance level, it may indicate a significant change in market sentiment and potentially signal a trend reversal.
- Breakdown: If the price breaks below a support level, it may continue to fall, indicating bearish sentiment.
- Breakout: If the price breaks above a resistance level, it may continue to rise, indicating bullish sentiment.
Psychological Aspect
Support and resistance levels are not just technical indicators but also reflect market psychology:
- Fear and Greed: These levels often form because of collective fear (leading to selling at resistance) and greed (leading to buying at support).
- Herd Behaviour: Many traders place buy/sell orders at these levels, reinforcing the strength of support and resistance.
Algorithmic Trading
Algorithmic trading, also known as algo-trading or automated trading, involves the use of computer programs to execute trading strategies based on predetermined criteria. These algorithms can process vast amounts of data and execute trades at speeds and frequencies that are impossible for a human trader.
How Algorithmic Trading Works
Strategy Development
- Quantitative Analysis: Traders and developers create algorithms based on quantitative analysis, which involves statistical and mathematical modeling of historical data.
- Backtesting: Before implementation, strategies are rigorously backtested against historical data to evaluate their performance and adjust parameters accordingly.
Programming
- Coding: The strategies are translated into code using programming languages such as Python, C++, or Java.
- Integration: These algorithms are then integrated into trading platforms that can execute trades automatically.
Execution
- Signal Generation: The algorithm continuously scans the market, waiting for signals that match the predefined criteria.
- Order Placement: When conditions are met, the algorithm places buy or sell orders. This can happen in milliseconds.
Monitoring and Adjustments
- Performance Monitoring: Continuous monitoring ensures that the algorithm performs as expected. Adjustments are made based on real-time market conditions and performance feedback.
Types of Algorithmic Trading Strategies
- Trend Following: Uses moving averages, channel breakouts, and related indicators to follow market trends.
- Arbitrage: Exploits price differences of the same asset in different markets or forms (e.g., spot vs. futures).
- Market Making: Involves placing both buy and sell orders to profit from the bid-ask spread.
- Mean Reversion: Assumes that prices will revert to their mean over time, and trades are made based on deviations from this mean.
- Statistical Arbitrage: Uses statistical methods to identify and exploit market inefficiencies.
- High-Frequency Trading (HFT): Involves executing a large number of orders at extremely high speeds, capitalizing on minute price discrepancies.
Pros of Algorithmic Trading
- Speed: Algorithms can process vast amounts of data and execute trades much faster than human traders, often in milliseconds.
- Accuracy: Reduces the likelihood of human error by adhering strictly to predefined criteria and rules.
- Consistency: Algorithms operate without emotional biases, making decisions purely based on data and strategy.
- Backtesting: Allows traders to test strategies against historical data to evaluate their viability before applying them in live markets.
- Efficiency: Can handle multiple trades simultaneously, improving market liquidity and reducing transaction costs.
Cons of Algorithmic Trading
- Complexity: Developing and maintaining effective algorithms requires significant expertise in both trading and programming.
- System Failures: Technical glitches, software bugs, or connectivity issues can lead to substantial losses.
- Overfitting: Algorithms optimized for historical data may perform poorly in live markets due to overfitting.
- Market Impact: High-frequency trading can contribute to market volatility and flash crashes.
- Regulatory Risks: Stringent regulations and compliance requirements can pose challenges.
Conclusion
Understanding and effectively using technical indicators can significantly enhance your trading strategies. Whether you prefer manual trading or algorithmic trading, mastering these tools can provide you with valuable insights into market movements and potential trading opportunities. Always remember to complement technical analysis with other forms of analysis and risk management strategies to make informed trading decisions. By optimizing your understanding of these indicators, you can improve your trading performance and make more informed decisions in the ever-changing financial markets. Happy trading!
