BASIC STRATEGIES FOR CASH MARKET
The cash market is where investors buy and sell securities for immediate settlement, implying that the trade happens, and the security is delivered on the same day. The cash market, also known as the spot market, involves the swift settlement of transactions in financial instruments such as stocks. Developing effective strategies for trading in the cash market can significantly enhance our trading performance. However, navigating the cash market requires a well-defined strategy. Below are ten fundamental strategies, their applications, and potential drawbacks.
1. Range Breakout Strategy
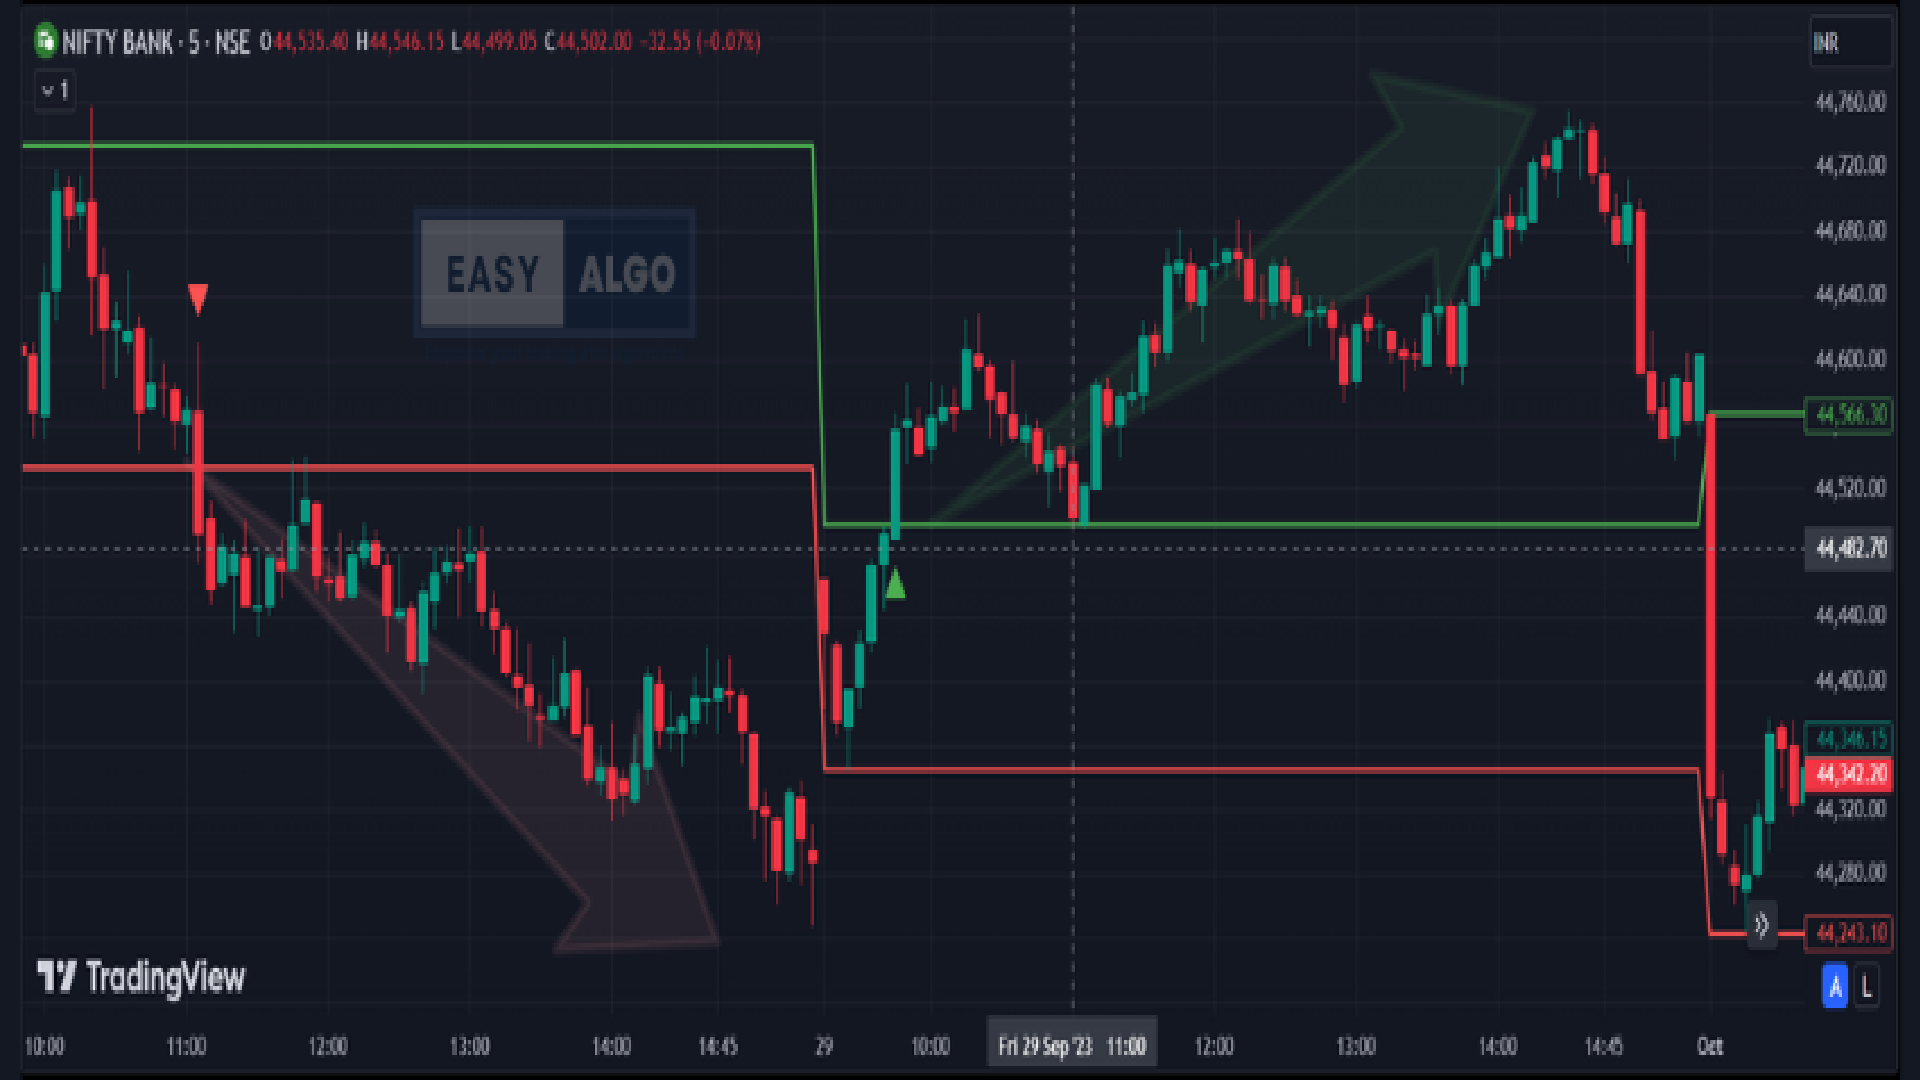
The Range Breakout strategy is a popular trading approach that capitalizes on the price movements of a stock once it breaks out of a defined price range. This strategy is rooted in the idea that once a stock moves beyond its established support or resistance levels, it often continues in that direction with significant momentum.
- Concept: A range in the stock market refers to a period during which the price of a stock trades between a specific high (resistance) and low (support). A Range Breakout occurs when the price moves beyond these established levels.
How to Use the Range Breakout Strategy:
Identify the Range:
- Support Level: The lowest price point in the range where the stock repeatedly finds buying interest.
- Resistance Level: The highest price point in the range where the stock repeatedly encounters selling pressure.
for the Breakout:
- Upward Breakout: The stock price closes above the resistance level.
- Downward Breakout: The stock price closes below the support level.
the Breakout:
- Volume: Ensure the breakout is accompanied by higher-than-average volume to confirm the strength of the move.
- Retest: Sometimes, the price will retest the breakout level. If it holds, it confirms the breakout.
Enter the Trade:
- Buy Position: Enter a long position when the price breaks above the resistance level.
- Sell Position: Enter a short position when the price breaks below the support level.
- Place stop-loss orders just below the breakout level for buy positions and just above the breakout level for sell positions. This helps manage risk in case the breakout fails.
Take Profits:
- Use trailing stops or set target prices based on previous price movements or technical indicators to lock in profits.
Drawbacks of the Range Breakout Strategy:
- False Breakouts: A significant risk in the Range Breakout strategy is the occurrence of false breakouts, where the price moves beyond the support or resistance level but then quickly reverses. This can lead to premature entries and losses.
- Market Volatility: High volatility can cause price fluctuations that appear to break out of the range but are merely temporary spikes. Such movements can trigger false signals.
- Delayed Confirmation: Waiting for volume confirmation and retests can sometimes result in entering the trade late, missing out on part of the move.
- Whipsaws: In choppy markets, the price may frequently break out of the range and then reverse, causing multiple whipsaws and potential losses.
2. Moving Average Crossover Strategy
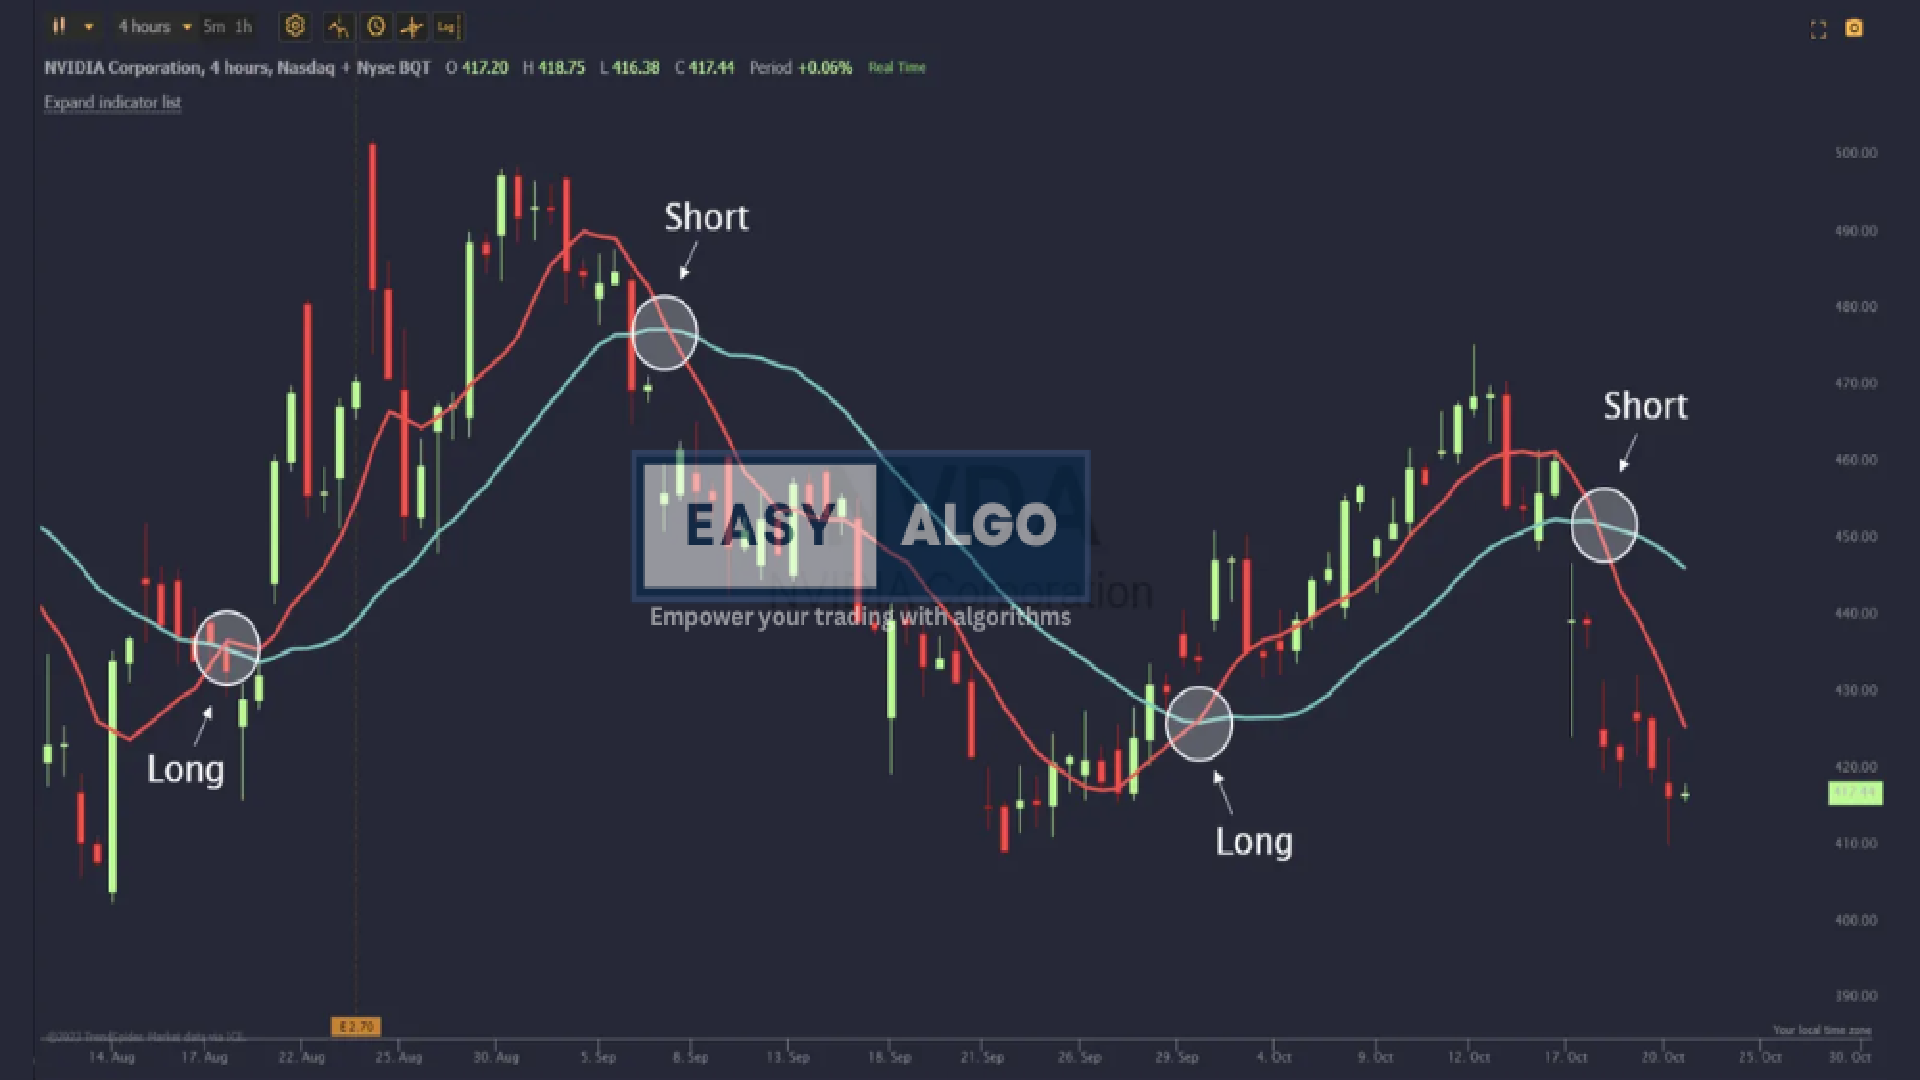
The Moving Average Crossover strategy is a straightforward, yet powerful tool used in technical analysis. It involves using two moving averages of different periods to generate buy and sell signals based on their crossover points.
How to Use the Moving Average Crossover Strategy:
Select Moving Averages:
- Short-Term Moving Average: Commonly a 50-day moving average.
- Long-Term Moving Average: Commonly a 200-day moving average.
Identify Crossover Points:
- Bullish Crossover (Golden Cross): Occurs when the short-term moving average crosses above the long-term moving average. This signals a potential uptrend and a buying opportunity.
- Bearish Crossover (Death Cross): Occurs when the short-term moving average crosses below the long-term moving average. This signals a potential downtrend and a selling opportunity.
Enter and Exit Trades:
- Buy Signal: Enter a long position when a bullish crossover occurs.
- Sell Signal: Enter a short position or exit a long position when a bearish crossover occurs.
Confirm the Signal:
- Use additional technical indicators (e.g., RSI, MACD) or volume analysis to confirm the crossover signal and avoid false signals.
Drawbacks of the Moving Average Crossover Strategy:
- Lagging Indicator: Moving averages are based on past price data, which means signals may be delayed. This can result in late entries and exits, potentially missing out on optimal trade opportunities.
- False Signals: In volatile or sideways markets, crossovers can occur frequently without leading to sustained trends, resulting in false signals and potential losses.
- Whipsaw Effect: Rapid market movements can cause frequent crossovers, leading to multiple trades in a short period and increasing transaction costs and potential losses.
3. Support and Resistance Breakout Strategy
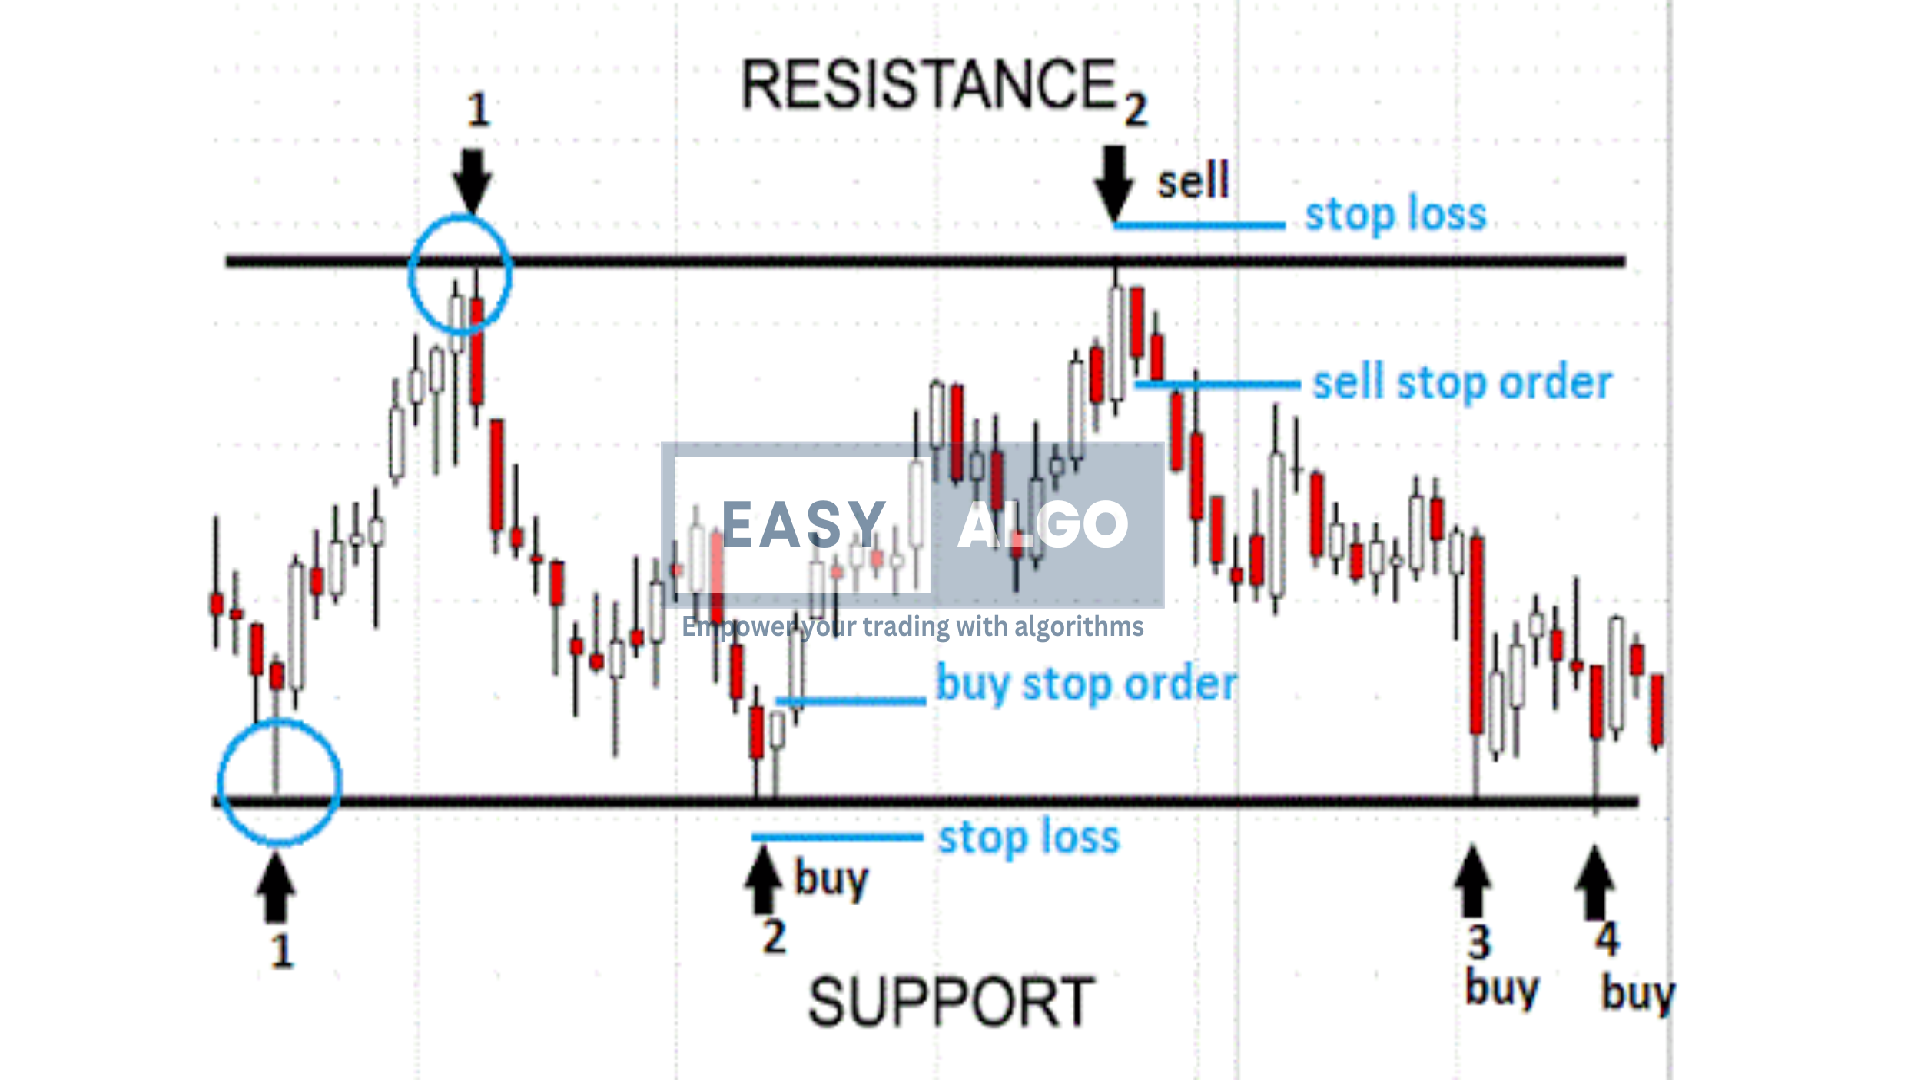
The Support and Resistance Breakout strategy is a fundamental technique in technical analysis. It involves identifying key support and resistance levels and taking positions when the price breaks out of these levels, indicating a potential new trend.
How to Use the Support and Resistance Breakout Strategy:
Identify Support and Resistance Levels:
- Support Level: The price level at which a stock consistently finds buying interest, preventing it from falling further.
- Resistance Level: The price level at which a stock consistently encounters selling pressure, preventing it from rising further.
Monitor for Breakouts:
- Upward Breakout: Occurs when the price breaks above the resistance level, suggesting a potential uptrend.
- Downward Breakout: Occurs when the price falls below the support level, suggesting a potential downtrend.
Confirm the Breakout:
- Look for increased trading volume during the breakout, as this indicates strong market interest and validates the breakout.
- Wait for a retest of the broken level (previous resistance or support) to confirm its new role as support or resistance.
Enter the Trade:
- Buy Position: Enter a long position when the price breaks above the resistance level and is confirmed by volume or retest.
- Sell Position: Enter a short position when the price breaks below the support level and is confirmed by volume or retest.
Set Stop-Loss Orders:
- For long positions, place a stop-loss just below the new support level (previous resistance).
- For short positions, place a stop-loss just above the new resistance level (previous support).
Take Profits:
- Use trailing stops or set target prices based on previous price movements or technical indicators to lock in profits.
Drawbacks of the Support and Resistance Breakout Strategy:
- False Breakouts: Prices may break out temporarily and then reverse, leading to false signals. This can result in premature entries and potential losses.
- Market Noise: In highly volatile or sideways markets, frequent price fluctuations can cause multiple breakouts, leading to inconsistent signals and possible losses.
- Delayed Confirmation: Waiting for volume confirmation or a retest can result in entering the trade later, potentially missing part of the move.
4. Trend Following Strategy
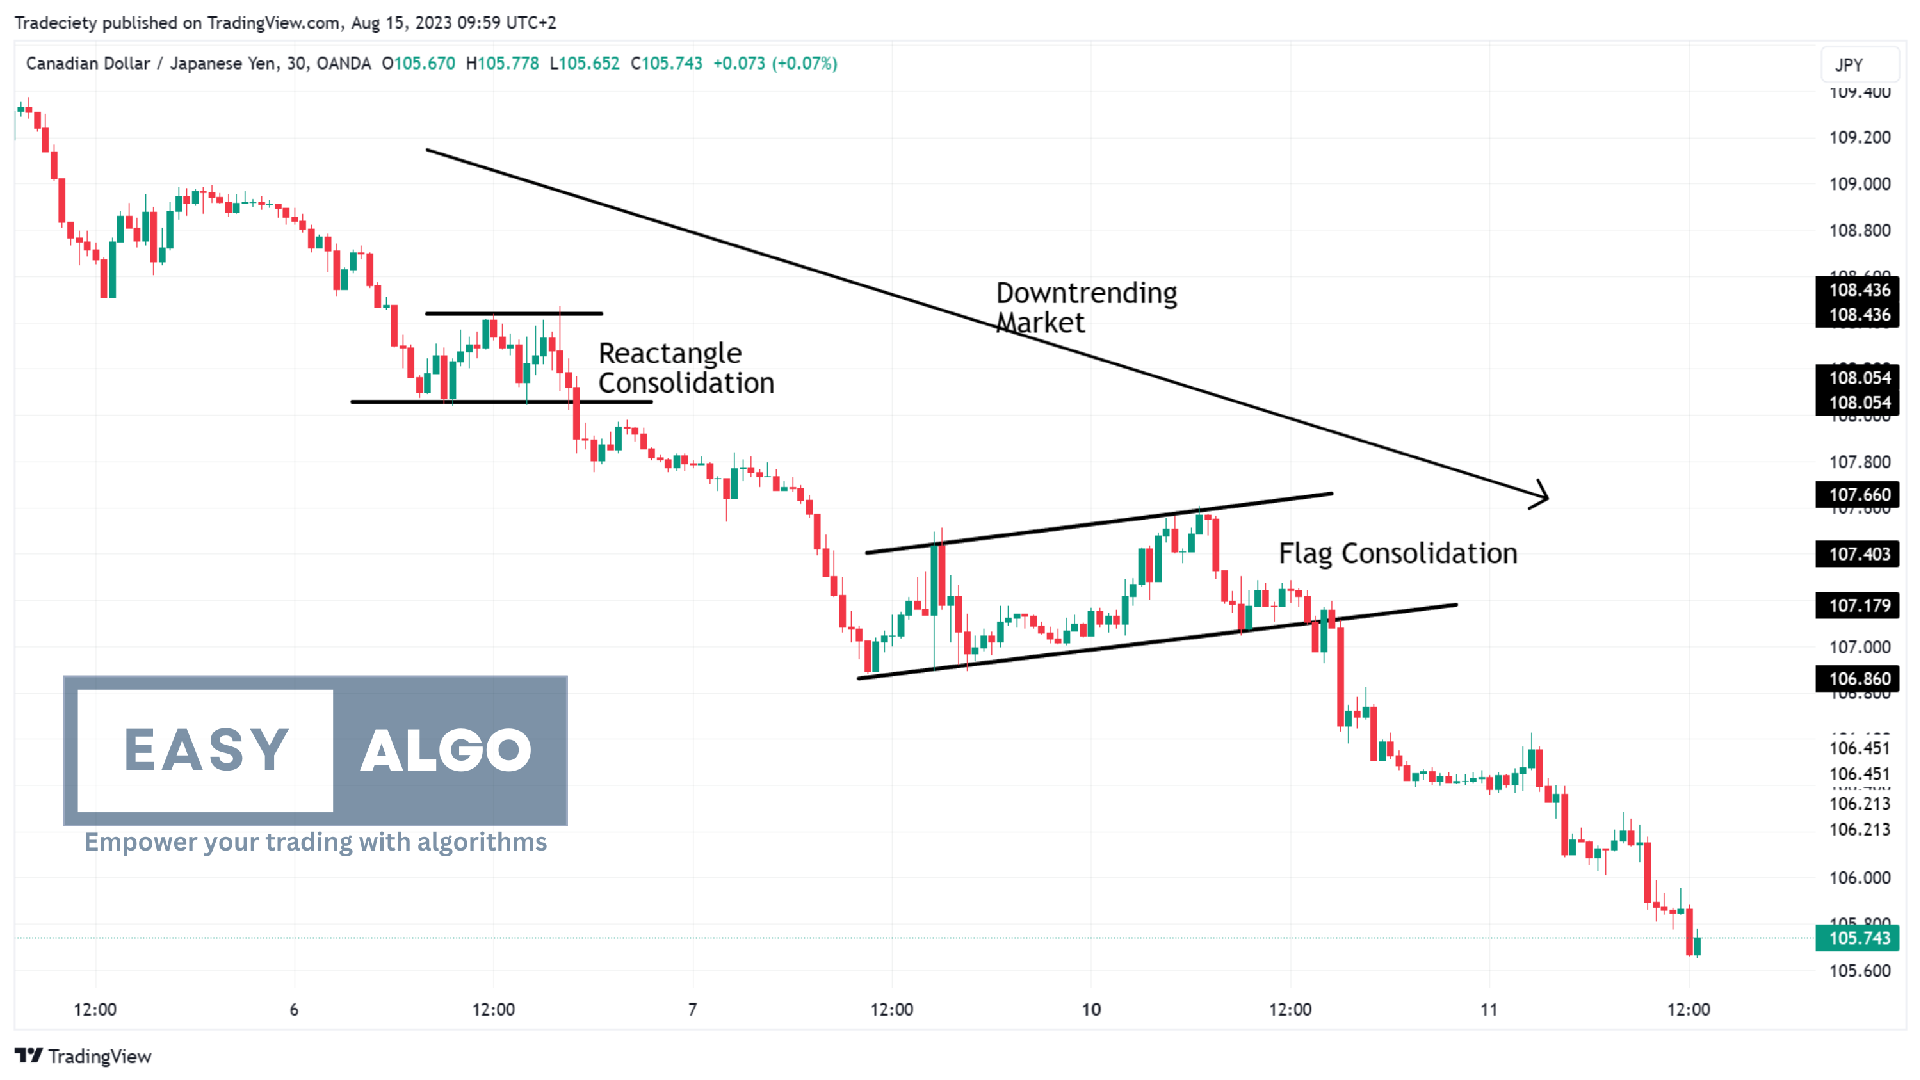
The Trend Following strategy is a popular trading approach that involves identifying and trading in the direction of the prevailing market trend. The primary goal is to capitalize on sustained price movements, whether upward (bullish) or downward (bearish).
How to Use the Trend Following Strategy:
Identify the Trend:
- Uptrend: Characterized by higher highs and higher lows. Indicators such as upward-sloping moving averages can help confirm an uptrend.
- Downtrend: Characterized by lower highs and lower lows. Downward-sloping moving averages can help confirm a downtrend.
Use Trend Indicators:
- Moving Averages: Use short-term (e.g., 50-day) and long-term (e.g., 200-day) moving averages to identify the trend direction.
- Trendlines: Draw trendlines connecting the lows in an uptrend or the highs in a downtrend to visualize the trend.
Enter Trades:
- Buy Position: Enter long positions in an uptrend when the price pulls back to the trendline or a key moving average.
- Sell Position: Enter short positions in a downtrend when the price rallies to the trendline or a key moving average.
Use Stop-Loss Orders:
- Place stop-loss orders below the recent low in an uptrend or above the recent high in a downtrend to manage risk.
Take Profits:
- Use trailing stops to lock in profits as the trend continues.
- Set target prices based on previous price movements or key resistance/support levels.
Drawbacks of the Trend Following Strategy:
- Lagging Indicator: Trend-following indicators often lag behind the price, potentially resulting in late entries and exits. This can lead to missed opportunities or diminished profits.
- Trend Reversals: Sudden trend reversals can result in significant losses if not identified early. It is crucial to monitor for signs of trend exhaustion or reversal.
- Sideways Markets: In choppy or sideways markets, trend-following strategies can generate false signals and lead to multiple whipsaws, increasing transaction costs and potential losses.
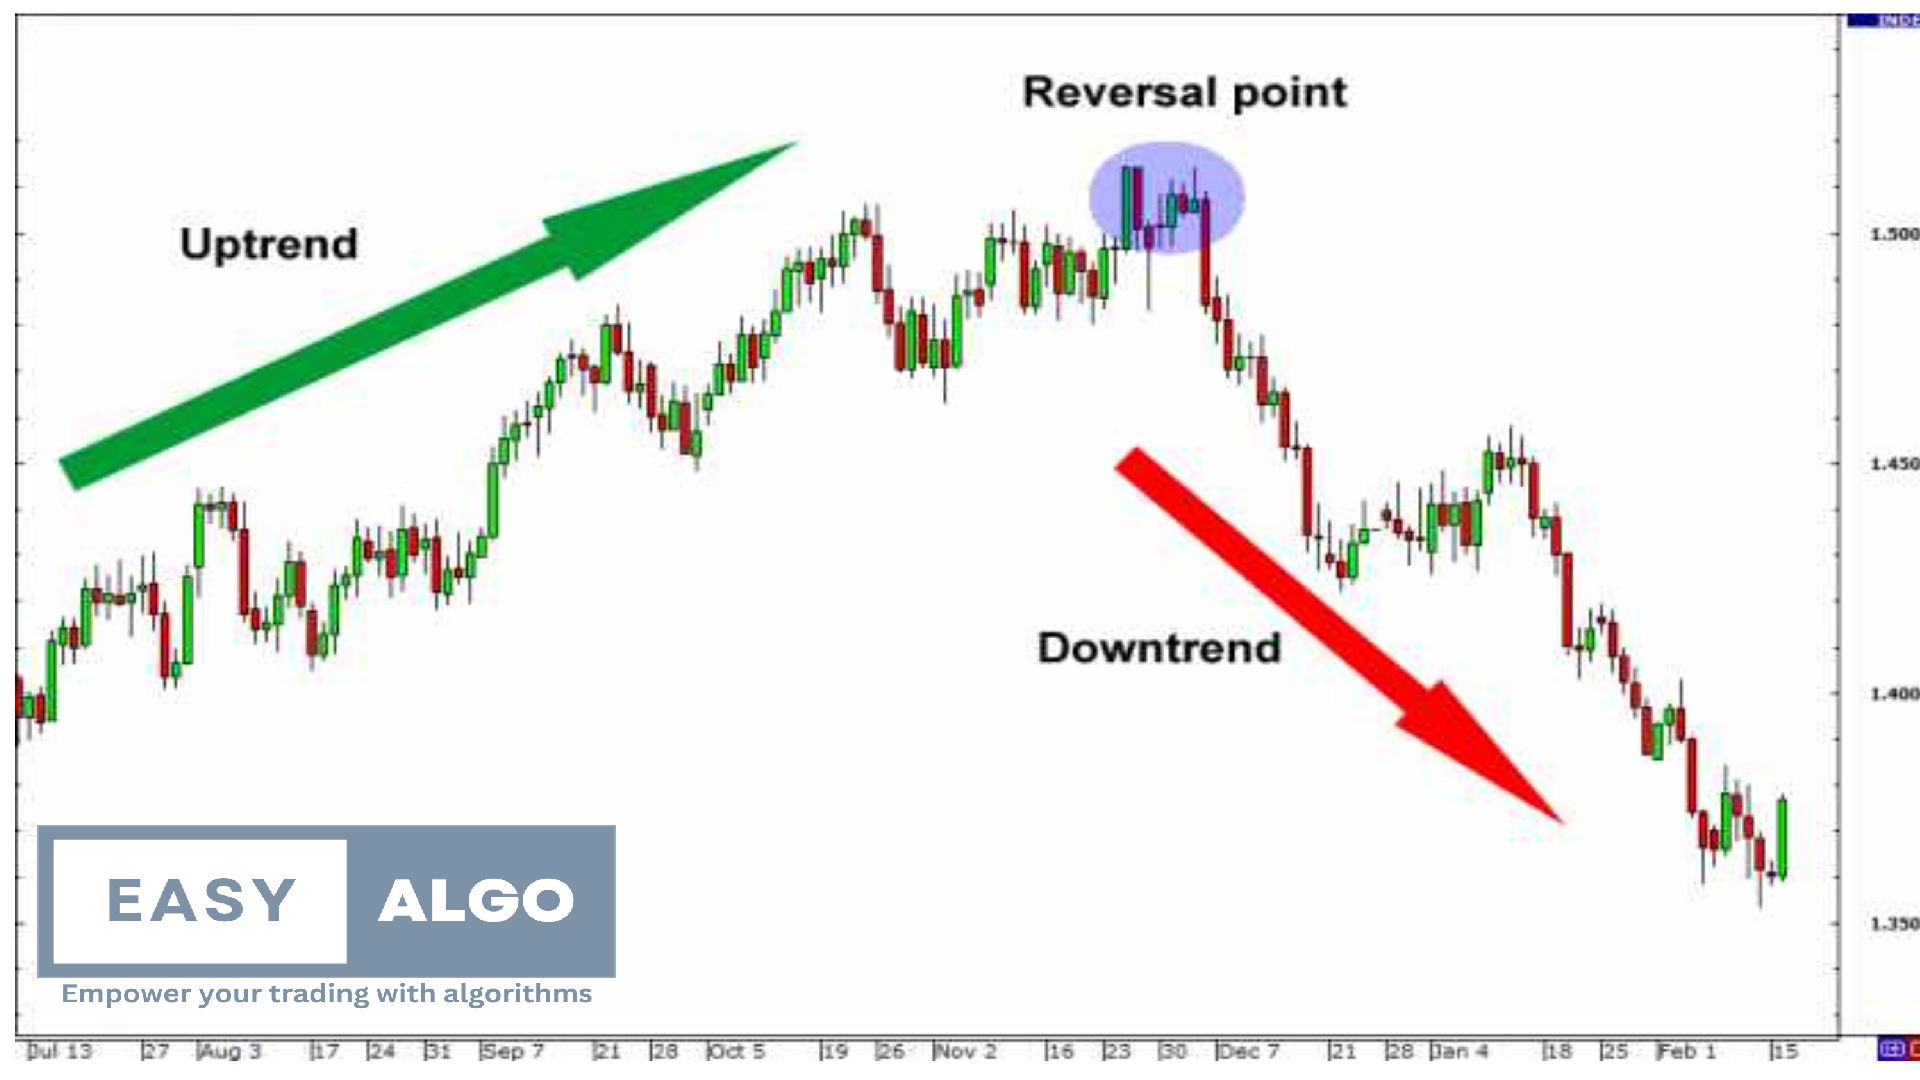
5. Reversal Trading Strategy
Reversal Trading is a strategy that involves identifying potential points where a prevailing trend is likely to reverse. Traders using this strategy aim to capitalize on these reversal points to enter positions early in the new trend direction.
How to Use the Reversal Trading Strategy:
Identify Reversal Patterns:
- Double Top/Bottom: A double top pattern indicates a potential reversal from an uptrend to a downtrend, while a double bottom pattern suggests a reversal from a downtrend to an uptrend.
- Head and Shoulders: A head and shoulders pattern signals a reversal from an uptrend to a downtrend, while an inverse head and shoulders pattern suggests a reversal from a downtrend to an uptrend.
- Candlestick Patterns: Look for reversal candlestick patterns such as hammer, shooting star, engulfing, and doji at key support or resistance levels.
Use Technical Indicators:
- Relative Strength Index (RSI): An RSI above 70 indicates overbought conditions, suggesting a potential reversal to the downside. An RSI below 30 indicates oversold conditions, suggesting a potential reversal to the upside.
- Moving Average Convergence Divergence (MACD): A bullish MACD crossover below the zero line indicates a potential reversal to the upside, while a bearish crossover above the zero line indicates a potential reversal to the downside.
Confirm the Reversal:
- Look for multiple signals and confirmation from various technical indicators and patterns to reduce the risk of false reversals.
Enter the Trade:
- Buy Position: Enter a long position when bullish reversal patterns or indicators confirm an upward reversal.
- Sell Position: Enter a short position when bearish reversal patterns or indicators confirm a downward reversal.
Stop-Loss Orders:
- Place stop-loss orders just below the support level for buy positions and just above the resistance level for sell positions to manage risk.
Profits:
- Set target prices based on previous price movements, Fibonacci retracement levels, or other technical analysis tools to lock in profits.
Drawbacks of the Reversal Trading Strategy:
- False Reversals: Identifying true reversals can be challenging, and false signals can result in premature entries and potential losses.
- Timing Risk: Entering a trade too early or too late in the reversal process can impact the profitability of the trade.
- Market Volatility: High market volatility can cause frequent price fluctuations, leading to false reversal signals and potential losses.
6. Momentum Trading Strategy
Momentum Trading is a strategy that involves capitalizing on the continuation of existing price trends. Traders using this strategy aim to enter positions when they believe the momentum will continue in the same direction, whether upward (bullish) or downward (bearish).
How to Use the Momentum Trading Strategy:
Identify Momentum:
- Price Movement: Look for stocks with strong price movement and upward or downward trends. Stocks experiencing significant price changes within a short period often exhibit momentum.
- Volume: High trading volume during price movements can confirm the presence of momentum.
Use Momentum Indicators:
- Relative Strength Index (RSI): An RSI above 70 indicates strong bullish momentum, while an RSI below 30 indicates strong bearish momentum.
- Moving Average Convergence Divergence (MACD): A bullish MACD crossover indicates upward momentum, while a bearish crossover indicates downward momentum.
- Rate of Change (ROC): The ROC measures the percentage change in price over a specific period, helping identify momentum.
Enter Trades:
- Buy Position: Enter long positions when the momentum indicators and price action suggest continued upward momentum.
- Sell Position: Enter short positions when the momentum indicators and price action suggest continued downward momentum.
Use Stop-Loss Orders:
- Place stop-loss orders to manage risk in case the momentum reverses.
Profits:
- Use trailing stops or set target prices based on previous price movements, key resistance/support levels, or other technical analysis tools to lock in profits.
Drawbacks of the Momentum Trading Strategy:
- Volatility: Momentum trading can be risky in highly volatile markets, as price movements can be unpredictable and lead to significant losses.
- False Signals: Momentum indicators can generate false signals, leading to premature entries and potential losses.
- Timing Risk: Entering trades too early or too late can impact the profitability of momentum trades.
.png)
7. Volume Trading Strategy
The Volume Trading strategy focuses on analyzing trading volume to make informed trading decisions. Volume is a key indicator of market activity and can provide insights into the strength of price movements and potential reversals.
How to Use the Volume Trading Strategy:
Analyze Volume Trends:
- Increasing Volume: Rising volume during an uptrend or downtrend indicates strong market interest and can confirm the trend's strength.
- Decreasing Volume: Declining volume during price movements may indicate a weakening trend and potential reversal.
Use Volume Indicators:
- On-Balance Volume (OBV): OBV measures cumulative buying and selling pressure. An increasing OBV during an uptrend confirms bullish momentum, while a decreasing OBV during a downtrend confirms bearish momentum.
- Volume Oscillator: The Volume Oscillator compares short-term and long-term volume averages to identify volume trends and potential reversals.
Confirm Price Movements:
- Use volume analysis to confirm price breakouts, reversals, and trend continuations. High volume during breakouts or reversals indicates strong market interest and validates the price movement.
Enter Trades:
- Buy Position: Enter long positions when rising volume confirms bullish price movements.
- Sell Position: Enter short positions when rising volume confirms bearish price movements.
Stop-Loss Orders:
- Place stop-loss orders to manage risk in case the volume trends reverse.
Take Profits:
- Set target prices based on previous price movements, key resistance/support levels, or other technical analysis tools to lock in profits.
Drawbacks of the Volume Trading Strategy:
- False Signals: Volume analysis can sometimes generate false signals, especially in low-volume markets or during periods of low liquidity.
- Market Manipulation: Volume can be manipulated by large market participants, leading to misleading signals and potential losses.
- Timing Risk: Entering trades based solely on volume analysis can result in timing risks, as volume trends may lag behind price movements.

8. Scalping Strategy
Scalping is a short-term trading strategy that involves making numerous small trades throughout the day to profit from minor price fluctuations. Scalpers aim to capture small price movements and accumulate profits over time.
How to Use the Scalping Strategy:
Focus on Liquid Markets:
- Trade in highly liquid markets with tight bid-ask spreads to minimize transaction costs and maximize profitability.
Use Technical Indicators:
- Moving Averages: Use short-term moving averages (e.g., 5-minute or 15-minute) to identify short-term trends and potential entry/exit points.
- Bollinger Bands: Bollinger Bands help identify overbought and oversold conditions, providing potential entry and exit signals.
- Stochastic Oscillator: The Stochastic Oscillator helps identify overbought and oversold conditions in the short term.
Enter and Exit Trades Quickly:
- Enter trades based on short-term price movements and technical indicators. Exit trades quickly to lock in small profits and minimize exposure to market fluctuations.
Use Tight Stop-Loss Orders:
- Place tight stop-loss orders to limit losses in case the price moves against the trade.
Monitor the Market Continuously:
- Stay alert and monitor the market continuously to identify trading opportunities and manage trades effectively.
Drawbacks of the Scalping Strategy:
- High Transaction Costs: Frequent trading can lead to high transaction costs, which can eat into profits. It is essential to trade in markets with low commissions and tight spreads.
- Intense Focus and Discipline: Scalping requires intense focus and discipline, as traders need to make quick decisions and manage trades actively.
- Psychological Pressure: The fast-paced nature of scalping can be psychologically demanding, leading to stress and potential burnout.
.png)
9. Swing Trading Strategy
Swing Trading is a medium-term trading strategy that involves capturing price swings within a trend. Swing traders aim to profit from short- to medium-term price movements over a few days to several weeks.
How to Use the Swing Trading Strategy:
Identify Trends and Patterns:
- Trendlines: Draw trendlines to identify the overall trend direction and potential support/resistance levels.
- Chart Patterns: Look for chart patterns such as triangles, flags, and head and shoulders to identify potential price swings.
Use Technical Indicators:
- Moving Averages: Use moving averages to identify trend direction and potential entry/exit points.
- Relative Strength Index (RSI): The RSI helps identify overbought and oversold conditions, providing potential entry and exit signals.
- MACD: The MACD helps identify trend changes and potential entry/exit points.
Enter Trades:
- Buy Position: Enter long positions when technical indicators and patterns suggest an upward price swing.
- Sell Position: Enter short positions when technical indicators and patterns suggest a downward price swing.
Use Stop-Loss Orders:
- Place stop-loss orders below support levels for buy positions and above resistance levels for sell positions to manage risk.
Take Profits:
- Set target prices based on previous price movements, key resistance/support levels, or other technical analysis tools to lock in profits.
Drawbacks of the Swing Trading Strategy:
- Overnight Risk: Holding positions overnight exposes swing traders to overnight risk and potential price gaps.
- False Signals: Technical indicators and patterns can generate false signals, leading to premature entries and potential losses.
- Timing Risk: Entering trades too early or too late in the price swing can impact the profitability of swing trades.
.png)
10. Algorithmic Trading Strategy
Algorithmic Trading, also known as algo trading or automated trading, involves using computer algorithms to execute trades based on predefined criteria. Algorithms can analyze vast amounts of data and execute trades at high speed, eliminating human emotions from the trading process.
How to Use the Algorithmic Trading Strategy:
Develop a Trading Algorithm:
- Define Criteria: Develop a trading algorithm based on specific criteria such as price movements, technical indicators, or other market conditions.
- Backtest: Backtest the algorithm using historical data to evaluate its performance and make necessary adjustments.
Implement the Algorithm:
- Trading Platform: Implement the algorithm on a trading platform that supports algorithmic trading.
- Automate Trades: Automate the execution of trades based on the algorithm's signals, ensuring timely and accurate order placement.
Monitor Performance:
- Continuously monitor the algorithm's performance and make adjustments as needed to optimize its effectiveness.
Manage Risk:
- Use risk management techniques such as position sizing, stop-loss orders, and diversification to manage risk and protect capital.
Drawbacks of the Algorithmic Trading Strategy:
- Technical Issues: Algorithmic trading relies on technology, and technical issues such as software bugs, connectivity problems, and hardware failures can impact performance.
- Market Conditions: Algorithms may not adapt well to changing market conditions, leading to potential losses.
- Complexity: Developing and maintaining a profitable algorithmic trading strategy requires advanced technical skills and continuous monitoring.
By understanding and implementing these trading strategies, you can develop a comprehensive trading plan that suits your risk tolerance, trading style, and financial goals. Remember that no strategy guarantees success, and it is essential to continuously learn, adapt, and refine your approach to navigate the dynamic world of trading.
11. Practical Steps for Implementing a Trading Strategy
Implementing a trading strategy involves several key steps to ensure that your approach is well-structured, effective, and aligned with your trading goals. Here are practical steps to help you implement your trading strategy:
Define Your Trading Goals:
- Determine your financial objectives, such as target returns, risk tolerance, and investment horizon. Your goals will guide your choice of trading strategies and influence your decision-making process.
Choose a Trading Strategy:
- Select a trading strategy that aligns with your goals, risk tolerance, and trading style. Consider factors such as time commitment, market knowledge, and available capital.
Develop a Trading Plan:
- Create a detailed trading plan that outlines your strategy, including entry and exit criteria, risk management rules, and performance metrics. Your trading plan should serve as a roadmap for executing trades and managing your portfolio.
Perform Technical and Fundamental Analysis:
- Conduct thorough analysis using technical indicators, chart patterns, and fundamental data to identify potential trading opportunities. This analysis will help you make informed decisions and increase the likelihood of success.
Backtest Your Strategy:
- Test your trading strategy using historical data to evaluate its performance and identify any weaknesses. Backtesting allows you to refine your approach and increase your confidence in the strategy.
Set Up a Trading Platform:
- Choose a reliable trading platform that offers the tools and features you need to execute your strategy effectively. Ensure the platform provides access to the markets and assets you plan to trade.
Implement Risk Management:
- Incorporate risk management techniques such as stop-loss orders, position sizing, and diversification to protect your capital and manage potential losses. Risk management is crucial for long-term success in trading.
Monitor and Adjust Your Strategy:
- Continuously monitor the performance of your trading strategy and make adjustments as needed. Market conditions and individual circumstances can change, so it is essential to stay flexible and adapt your approach.
Keep a Trading Journal:
- Maintain a trading journal to record your trades, including entry and exit points, rationale, and outcomes. Reviewing your journal can help you identify patterns, learn from mistakes, and improve your trading skills.
Stay Informed and Educated:
- Keep up with market news, trends, and developments to stay informed and make better trading decisions. Continuous learning and education are vital for staying ahead in the dynamic world of trading.
By following these practical steps, you can effectively implement a trading strategy that aligns with your goals and maximizes your chances of success. Remember that trading involves risks, and it is essential to approach it with discipline, patience, and a commitment to continuous improvement.
12. Essential Trading Tools and Resources
Successful trading requires access to a range of tools and resources that can help you analyze markets, execute trades, and manage your portfolio effectively. Here are some essential trading tools and resources:
Trading Platform:
- A reliable trading platform is crucial for executing trades and accessing market data. Look for platforms that offer user-friendly interfaces, advanced charting tools, and a wide range of order types.
Charting Software:
- High-quality charting software allows you to analyze price movements, identify patterns, and apply technical indicators. Popular charting tools include TradingView, MetaTrader, and Thinkorswim.
News and Analysis Services:
- Staying informed about market news and events is essential for making informed trading decisions. Use news and analysis services such as Bloomberg, Reuters, and CNBC to stay updated on market developments.
Economic Calendars:
- Economic calendars provide information on upcoming economic events, such as central bank meetings, economic data releases, and geopolitical events. These events can impact market volatility and provide trading opportunities.
Technical Indicators:
- Technical indicators are essential tools for analyzing price movements and identifying trading signals. Common indicators include moving averages, RSI, MACD, Bollinger Bands, and Fibonacci retracement levels.
Risk Management Tools:
- Risk management tools, such as stop-loss and take-profit orders, help you manage potential losses and protect your capital. Ensure your trading platform offers these tools to implement effective risk management strategies.
Trading Journal:
- A trading journal allows you to record and review your trades, helping you identify patterns, learn from mistakes, and improve your trading skills. Use tools like Edgewonk, TradingDiary Pro, or a simple spreadsheet to maintain your journal.
Educational Resources:
- Continuous learning is essential for trading success. Access educational resources such as trading courses, webinars, books, and online forums to enhance your knowledge and skills. Popular resources include Investopedia, Babypips, and Coursera.
Backtesting Software:
- Backtesting software allows you to test your trading strategies using historical data to evaluate their performance. Tools like MetaTrader, TradingView, and NinjaTrader offer backtesting capabilities to help you refine your strategies.
Services:
- Choose a reputable brokerage that offers competitive fees, a wide range of tradable assets, and robust customer support. Your broker should provide access to the markets and instruments you plan to trade.
Conclusion
Mastering trading strategies requires a combination of knowledge, skill, and experience. By understanding and implementing various trading strategies, you can develop a comprehensive trading plan that aligns with your goals and maximizes your chances of success. Remember to approach trading with discipline, patience, and a commitment to continuous learning. Utilize essential trading tools and resources to enhance your analysis, execution, and risk management. With the right approach, you can navigate the dynamic world of trading and achieve your financial objectives.

