Understanding Candlestick Charts: A Comprehensive Guide for Traders
One of the most popular tools in technical analysis for traders is the candlestick chart. They offer a visual depiction of price changes over a predetermined period, providing insights into market sentiment and potential future price movements. Each candlestick represents four essential data points: open, high, low, and close (OHLC).
What is a Candlestick Chart?
Candlestick Chart
A candlestick chart is a type of price chart used in technical analysis that displays the high, low, open, and closing prices of a security (stock, bond, commodity, etc.) for a specific period.
Candlestick Pattern
A candlestick pattern is a specific arrangement of candlesticks on a chart that some traders believe indicates future price movements. There are many different candlestick patterns, each with its interpretation. Technical analysts use these patterns to try to predict the direction of future price movements.
Structure of a Candlestick
A candlestick consists of several parts:
Body
- The thick part of the candlestick.
- Represents the range between the opening and closing prices of the trading period.
- A bullish body (closing price higher than the opening price) is usually green or white.
- A bearish body (closing price lower than the opening price) is typically red or black.
Wicks (or Shadows)
- Thin lines extending above and below the body.
- The upper wick represents the highest price reached during the trading period.
- The lower wick represents the lowest price reached during the trading period.
Open
- The price at which the security starts trading when the period begins.
- Marked by the top of the body in a bearish candle and the bottom of the body in a bullish candle.
High
- The highest price reached during the trading period.
- Indicated by the top of the upper wick.
Low
- The lowest price reached during the trading period.
- Indicated by the bottom of the lower wick.
Close
- The final price at which the security trades during the period.
- Marked by the bottom of the body in a bearish candle and the top of the body in a bullish candle.
Example of a Candlestick
Interpreting Candlesticks
Candlesticks provide a wealth of information about market psychology. Here are some basic interpretations:
Bullish Candlestick
- A candlestick with a closing price higher than the opening price (green or white body).
- Indicates buying pressure and potential upward momentum.
Bearish Candlestick
- A candlestick with a closing price lower than the opening price (red or black body).
- Indicates selling pressure and potential downward momentum.
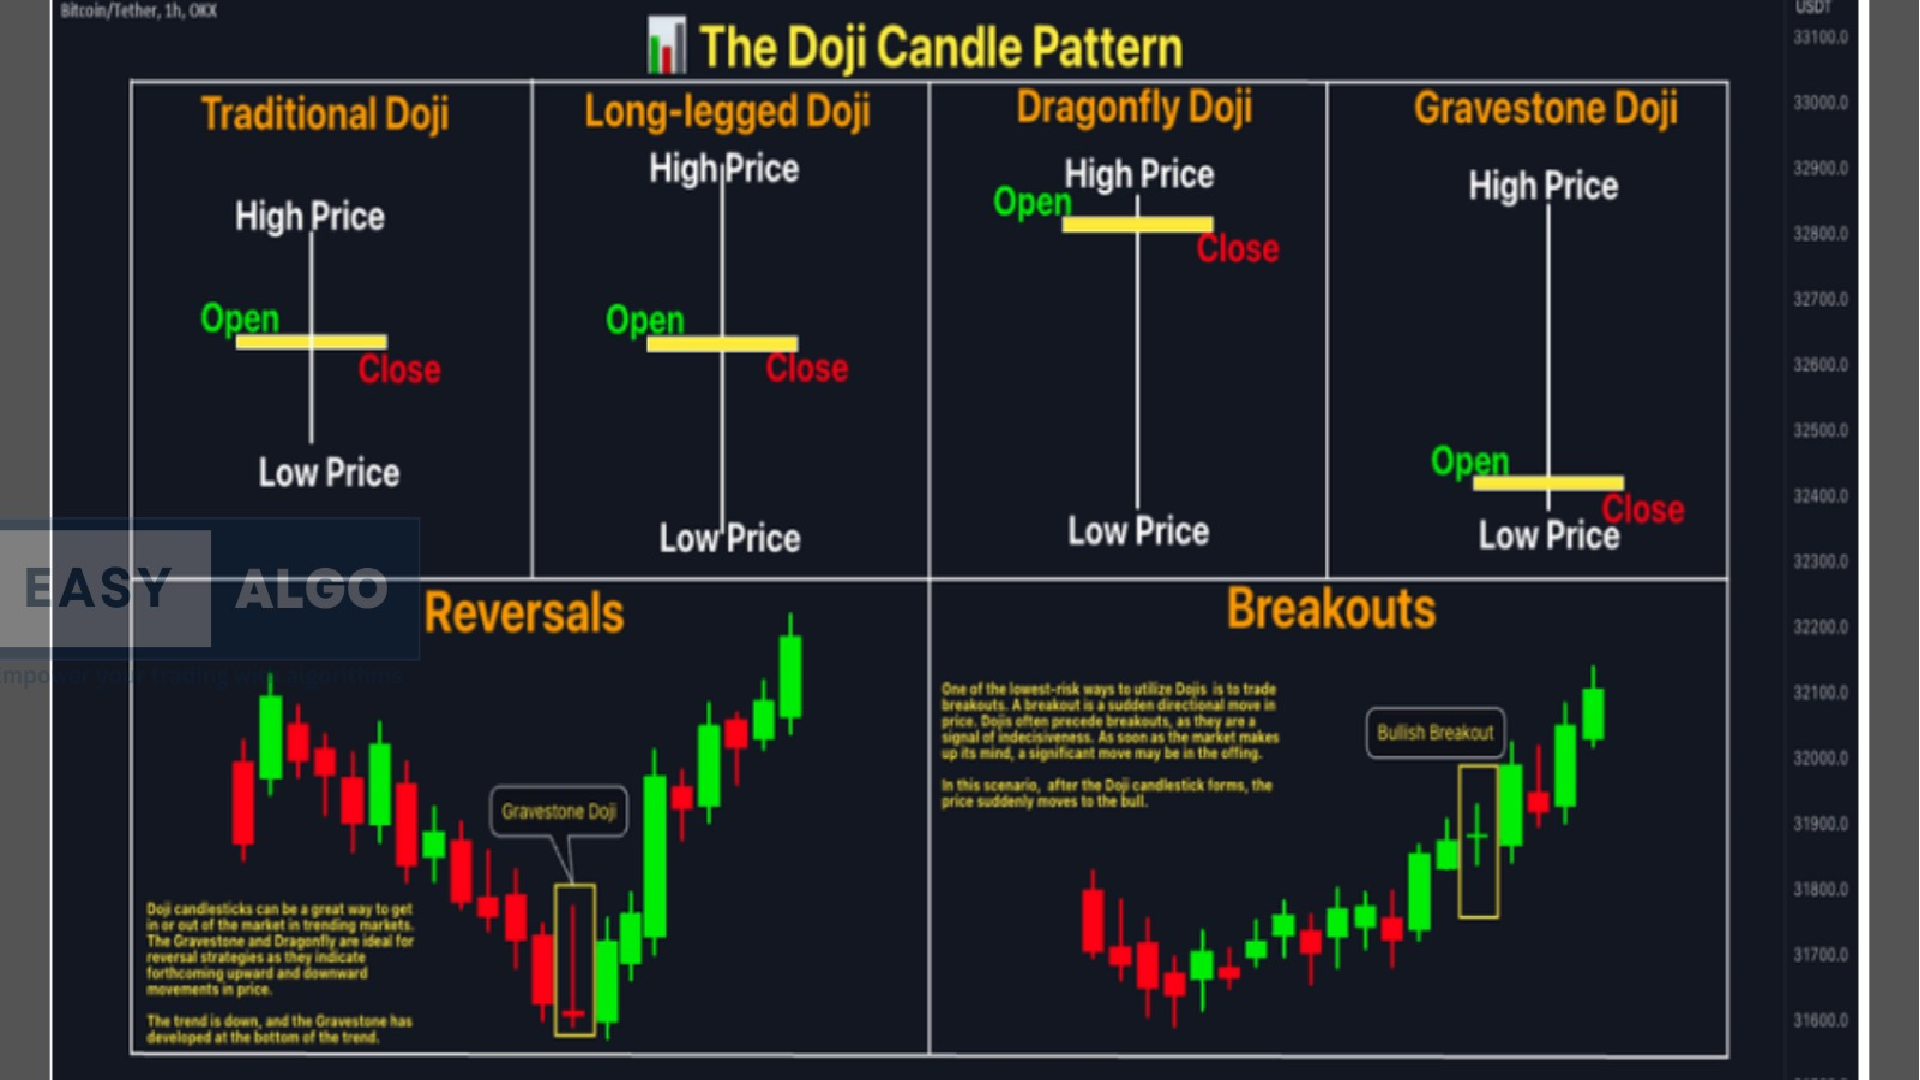
Doji
- A candlestick where the opening and closing prices are nearly the same, resulting in a very small body.v
- Signifies indecision in the market, often preceding a potential reversal.
.png)
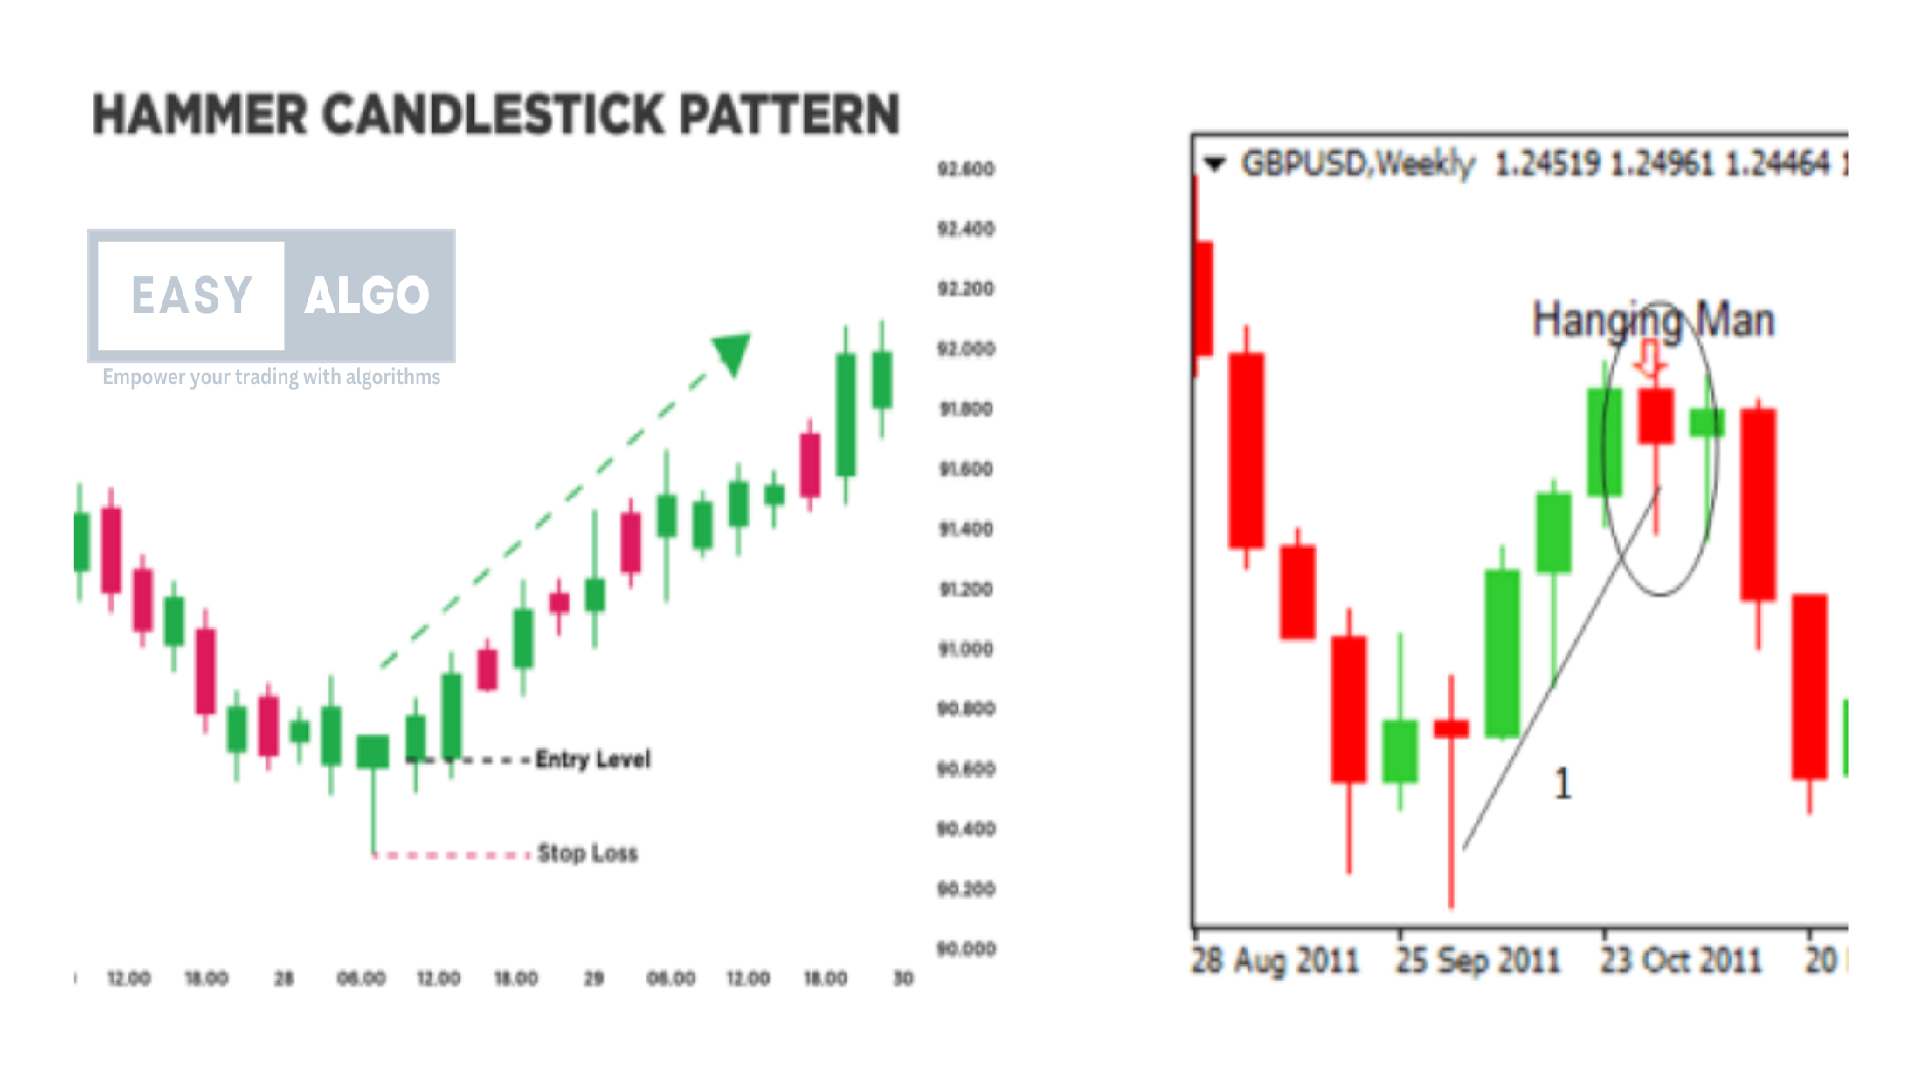
Hammer and Hanging Man
- Hammer: Appears at the bottom of a downtrend, indicating potential bullish reversal.
- Hanging Man: Appears at the top of an uptrend, indicating potential bearish reversal.
.png)
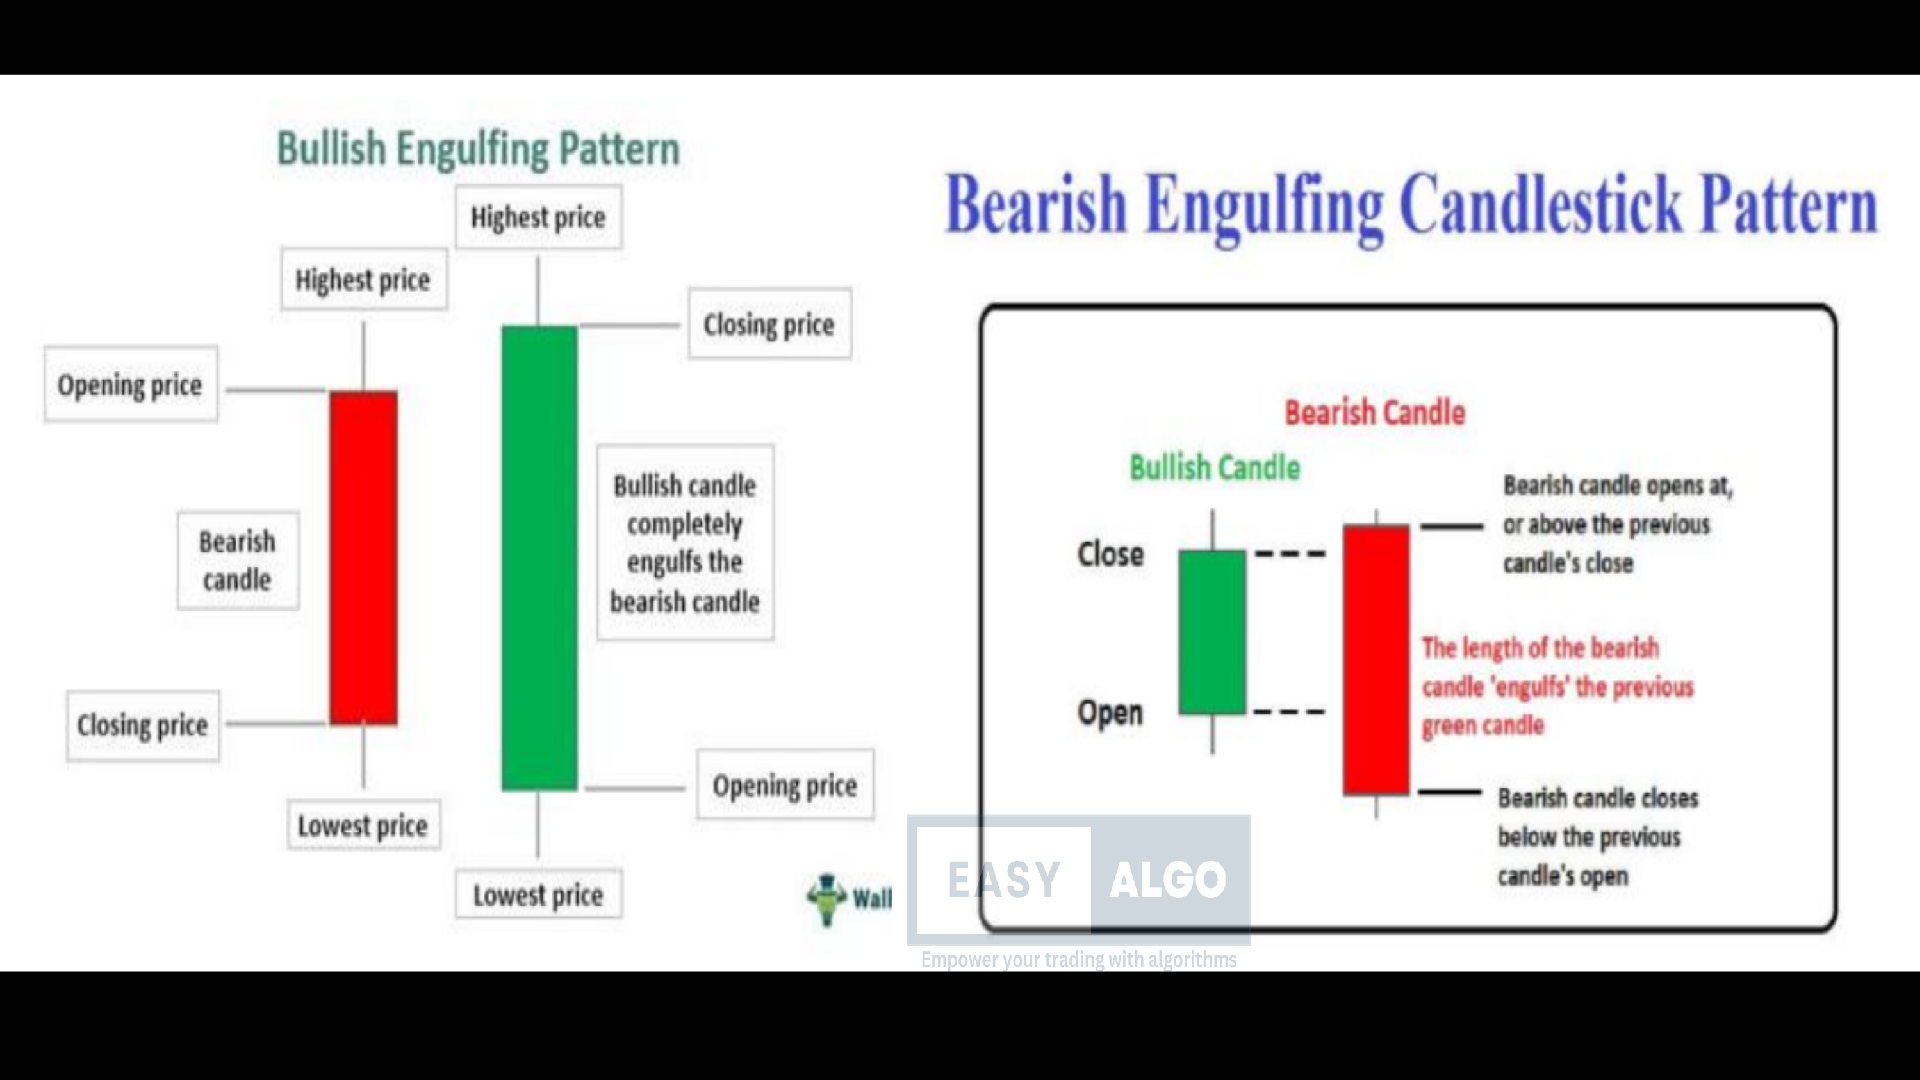
Engulfing Patterns
- Bullish Engulfing Pattern: A small bearish candle followed by a larger bullish candle that completely engulfs the previous candle’s body, suggesting a potential bullish reversal.
- Bearish Engulfing Pattern: A small bullish candle followed by a larger bearish candle that completely engulfs the previous candle’s body, suggesting a potential bearish reversal.
Understanding Key Candlestick Data Points
Open
- Reflects the market's initial sentiment at the start of the trading period.
- Can act as a psychological level of support or resistance.
High
- Indicates the highest price reached during the trading period.
- Helps assess the volatility and strength of price movements.
Low
- Indicates the lowest price reached during the trading period.
- Crucial for assessing the volatility and strength of price movements.
Close
- The final price at which a security is traded during a specific trading period.
- A key indicator of market sentiment at the end of the trading period.
Types of Candlestick Patterns
Candlestick patterns are essential tools in technical analysis, helping traders predict potential market movements by examining past price data. Here are some of the most common and significant types of candlesticks and their implications:
Doji
A Doji candlestick has a very small body, indicating that the opening and closing prices are virtually the same. It features long wicks, suggesting high volatility during the trading period, but the opening and closing prices remained close to each other. Dojis often signal indecision in the market, with neither buyers nor sellers gaining dominance. Different types of doji patterns like gravestone doji and dragonfly doji can offer more specific indications depending on their location within the trend.
- Indicates market indecision.
- Indicates market indecision.
Hammer and Hanging Man
Both have small bodies with long lower wicks and little or no upper wick. The body can be either bullish (green/white) or bearish (red/black).
- Hammer: Appears at the bottom of a downtrend, indicating potential bullish reversal.
- Hanging Man: Appears at the top of an uptrend, indicating potential bearish reversal.
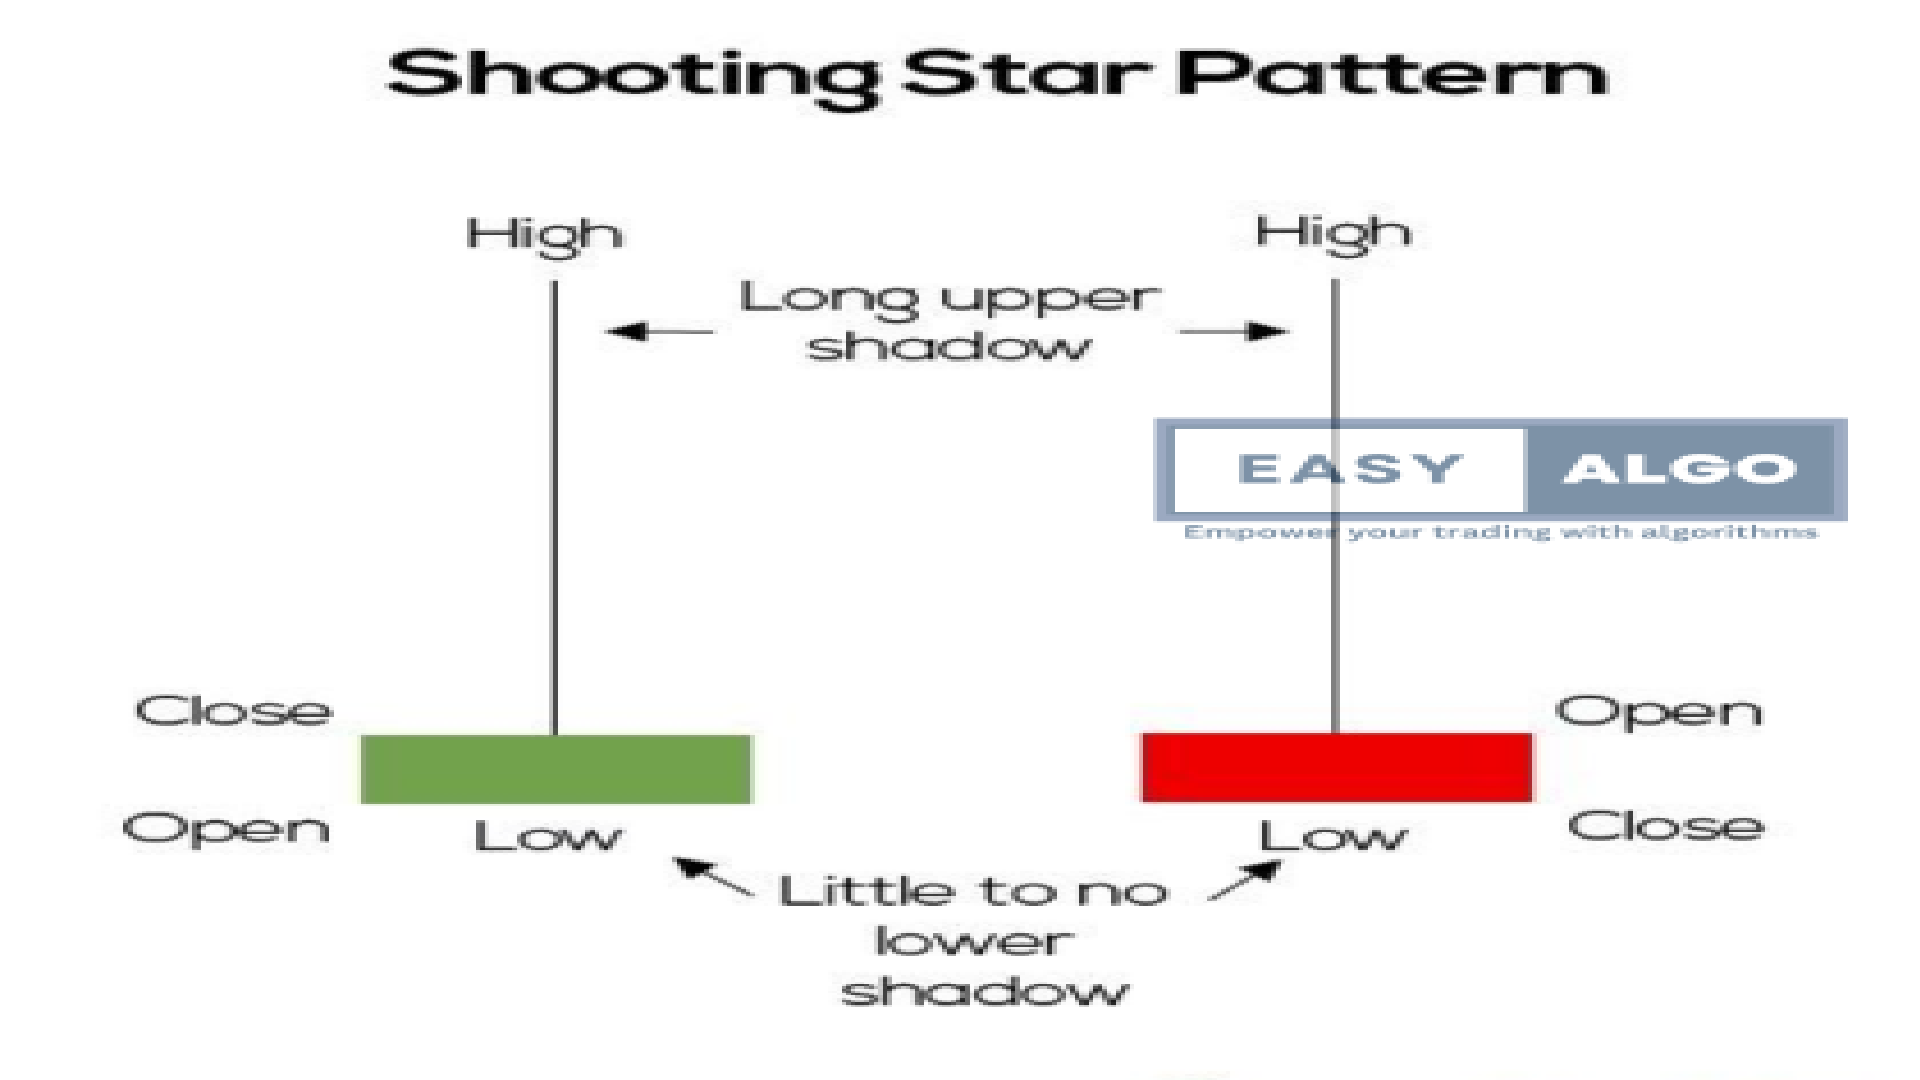
Shooting Star and Inverted Hammer
Both have small bodies with long upper wicks and little or no lower wick. The body can be either bullish or bearish
- Shooting Star: Appears at the top of an uptrend, indicating potential bearish reversal.
- Inverted Hammer: Appears at the bottom of a downtrend, indicating potential bullish reversal.
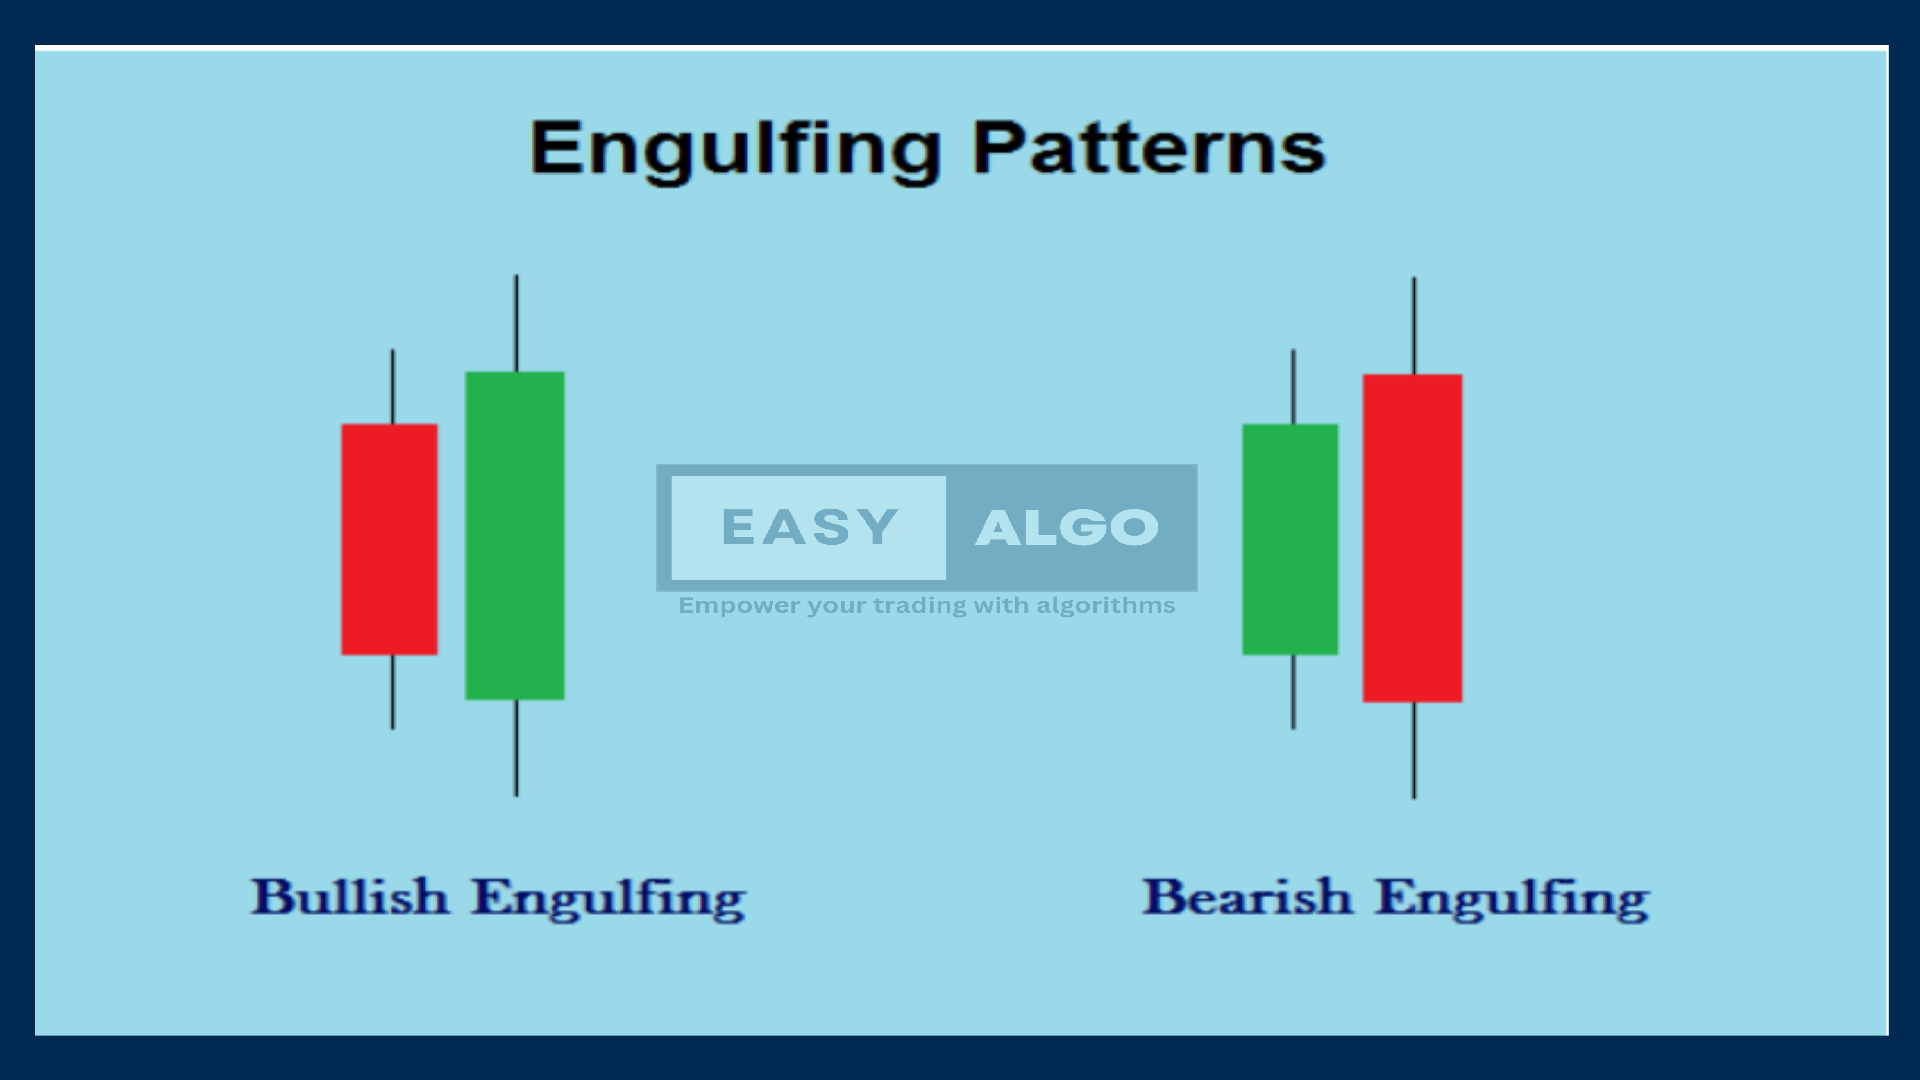
Engulfing Patterns
- Bullish Engulfing: Indicates a potential bullish reversal
- Bearish Engulfing: Indicates a potential bearish reversal.
A small bearish candlestick is followed by a larger bullish candlestick that completely engulfs
the previous candle’s body.
Indicates a potential bullish reversal, suggesting that buyers have taken control.
A small bullish candlestick is followed by a larger bearish candlestick that completely engulfs
the previous candle’s body.
Indicates a potential bearish reversal, suggesting that sellers have taken control.
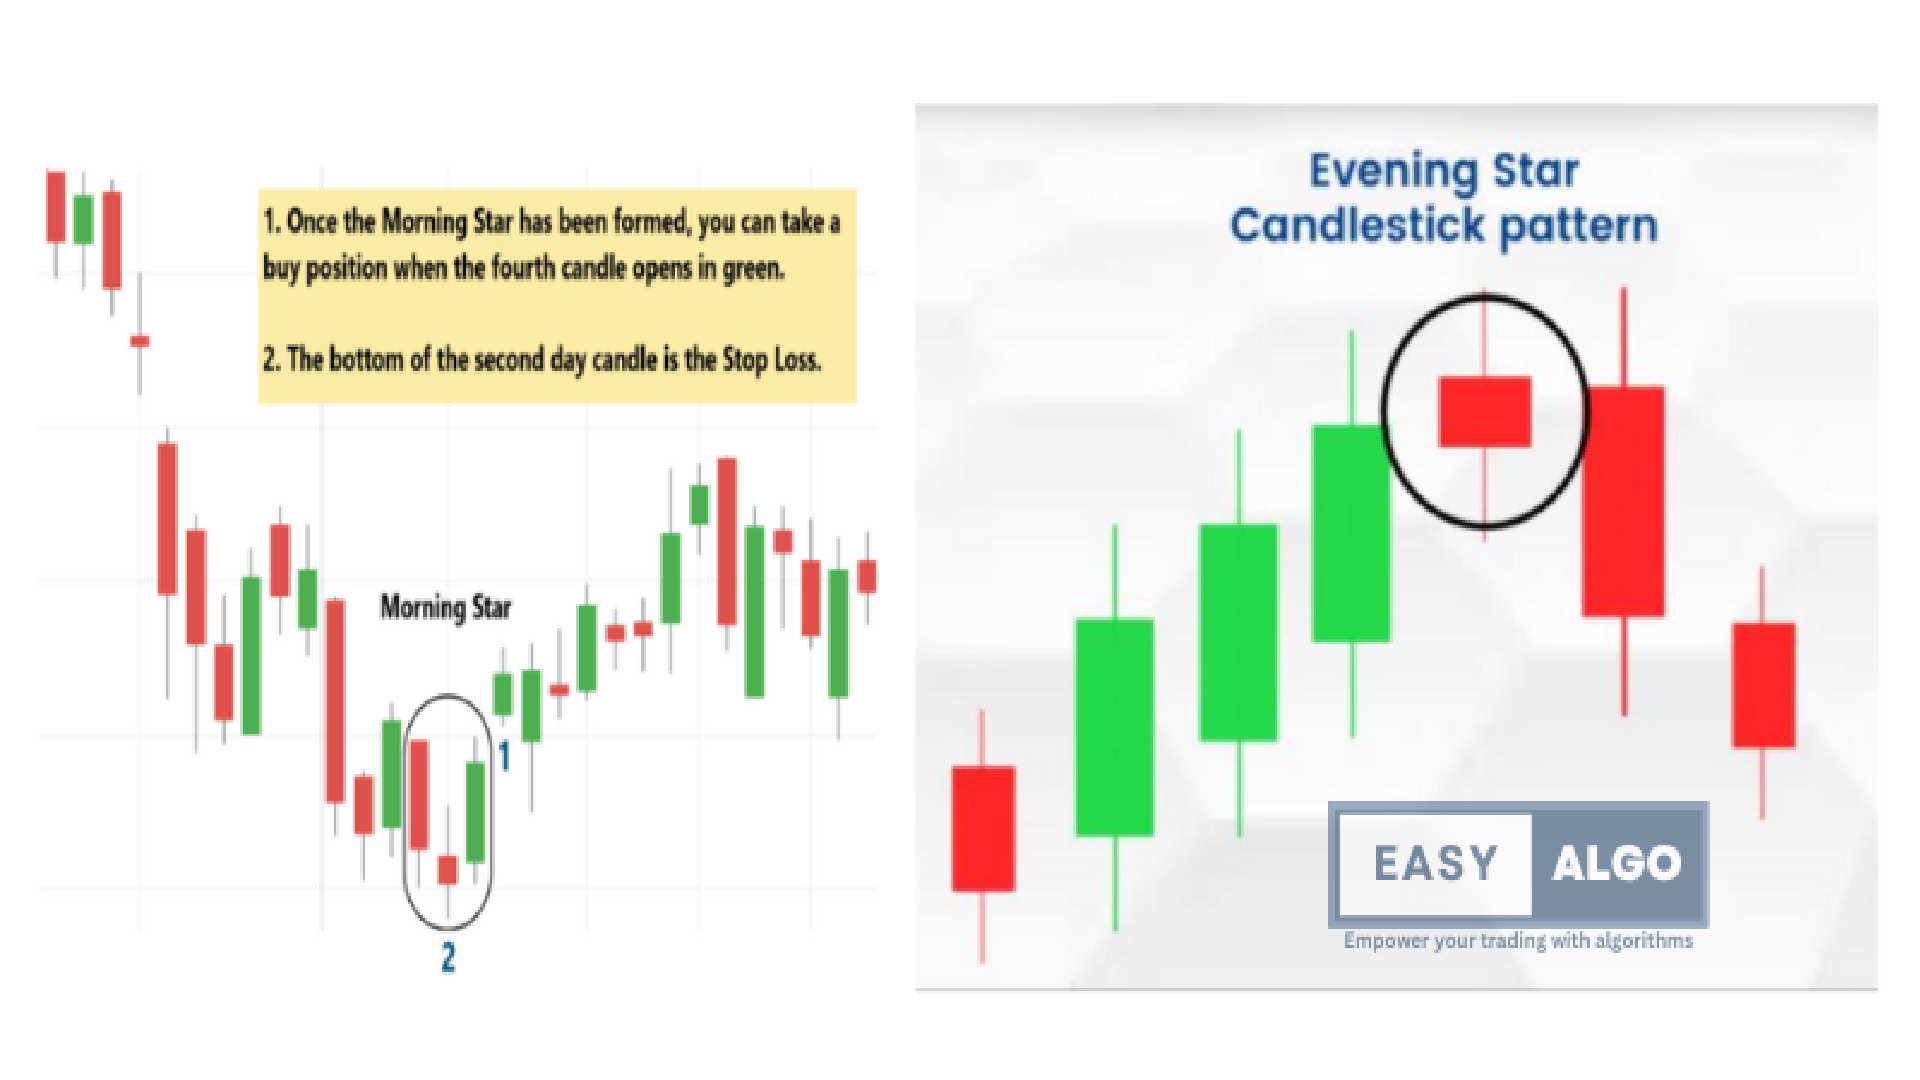
Morning Star and Evening Star
Morning Star
- A three-candle pattern that starts with a long bearish candle, followed by a small-bodied candle (bullish or bearish), and ends with a long bullish candle
- Appears at the bottom of a downtrend and signals a potential bullish reversal.
Evening Star
- A three-candle pattern that starts with a long bullish candle, followed by a small-bodied candle, and ends with a long bearish candle.
- Appears at the top of an uptrend and signals a potential bearish reversal.
Advanced Candlestick Patterns
Three White Soldiers and Three Black Crows
- Three White Soldiers: Consists of three consecutive long bullish candlesticks, each with a higher close than the previous one. It suggests strong bullish momentum.
- Three Black Crows: Consists of three consecutive long bearish candlesticks, each with a lower close than the previous one. It indicates strong bearish momentum.
Dark Cloud Cover and Piercing Pattern
- Dark Cloud Cover: A bearish reversal pattern where a long bullish candlestick is followed by a bearish candlestick that opens above the previous candle’s high and closes below its midpoint.
- Piercing Pattern: A bullish reversal pattern where a long bearish candlestick is followed by a bullish candlestick that opens below the previous candle’s low and closes above its midpoint.
Harami Patterns
- Bullish Harami: A small bullish candlestick within the range of the previous bearish candlestick, suggesting a potential bullish reversal.
- Bearish Harami: A small bearish candlestick within the range of the previous bullish candlestick, indicating a potential bearish reversal.
Tweezer Tops and Bottoms
- Tweezer Tops: A bearish reversal pattern where two or more candlesticks have the same high, indicating resistance.
- Tweezer Bottoms: A bullish reversal pattern where two or more candlesticks have the same low, indicating support.
Tips for Using Candlestick Charts in Trading
- Combine with Other Indicators: Use candlestick patterns in conjunction with other technical indicators such as moving averages, RSI, and MACD for more accurate predictions.
- Consider the Context: Always consider the broader market context and trends. Candlestick patterns are more reliable when aligned with the overall market trend.
- Practice Risk Management: Use stop-loss orders and manage your risk to protect against potential losses.
- Stay Updated: Keep up with market news and events that could impact the prices of the securities you are trading.
Conclusion
understanding candlestick charts and their patterns is crucial for making informed trading decisions. By analyzing these patterns and the key data points (open, high, low, close), traders can gain insights into market sentiment and potential future price movements. For more detailed analysis and trading strategies using candlestick charts, stay tuned to our blog.
