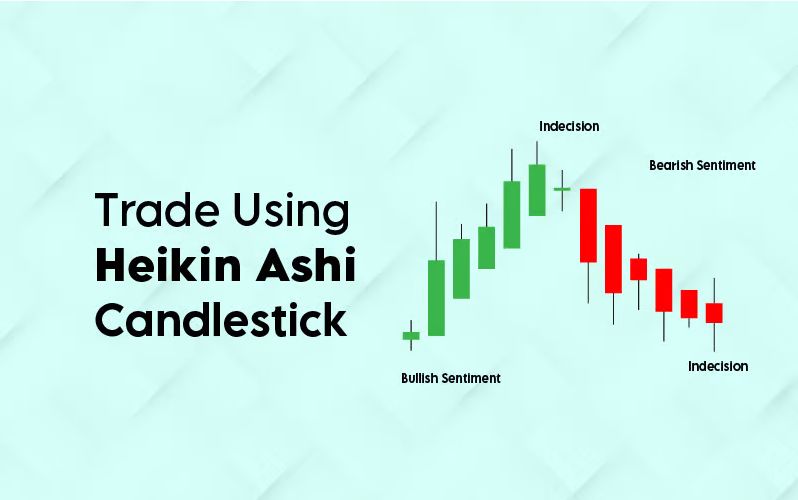
Heikin-Ashi charts are a powerful tool for identifying trends and potential reversal points in the market. They can help you visualize price action more clearly and provide insights into market volatility. However, it's important to use Heikin-Ashi charts in conjunction with other technical analysis tools and to exercise caution when interpreting signals. What's your favorite candlestick chart type or pattern? Share in the comments below! And if you're interested in developing your trading ideas into algorithms, visit our website at easyalgo.in or contact us at +90-8448735946 or via WhatsApp to learn how we can help. Image Source - Indiacharts.com

