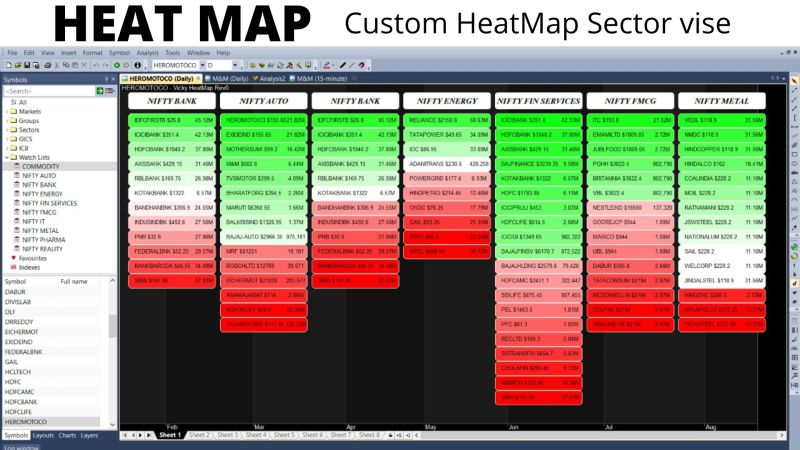
"Using Stock Heatmaps to Identify Sector Strength: A Powerful Tool for Traders" Stock heatmaps are a popular and effective tool that traders use to identify sector strength. By using color-coded tables that display the performance of stocks in a particular sector, traders can quickly and easily identify which sectors are outperforming or underperforming the broader market. One popular website where traders can use free stock heatmaps is Tradingview . Tradingview offers customizable heatmaps that allow users to filter stocks by sector, market cap, and other criteria. This can help traders to identify trends, spot potential opportunities, and make more informed trading decisions. In addition to using stock heatmaps, traders can also convert their trading ideas into algorithmic trading strategies and fully automated bots. This can help traders to execute their trades more efficiently and effectively, and to take advantage of market opportunities more quickly. If you're interested in converting your trading ideas into algorithmic trading strategies and fully automated bots, you can call or WhatsApp us at +91-8448735946, Our team of experts can help you to develop and implement trading strategies that are tailored to your specific needs and goals.

