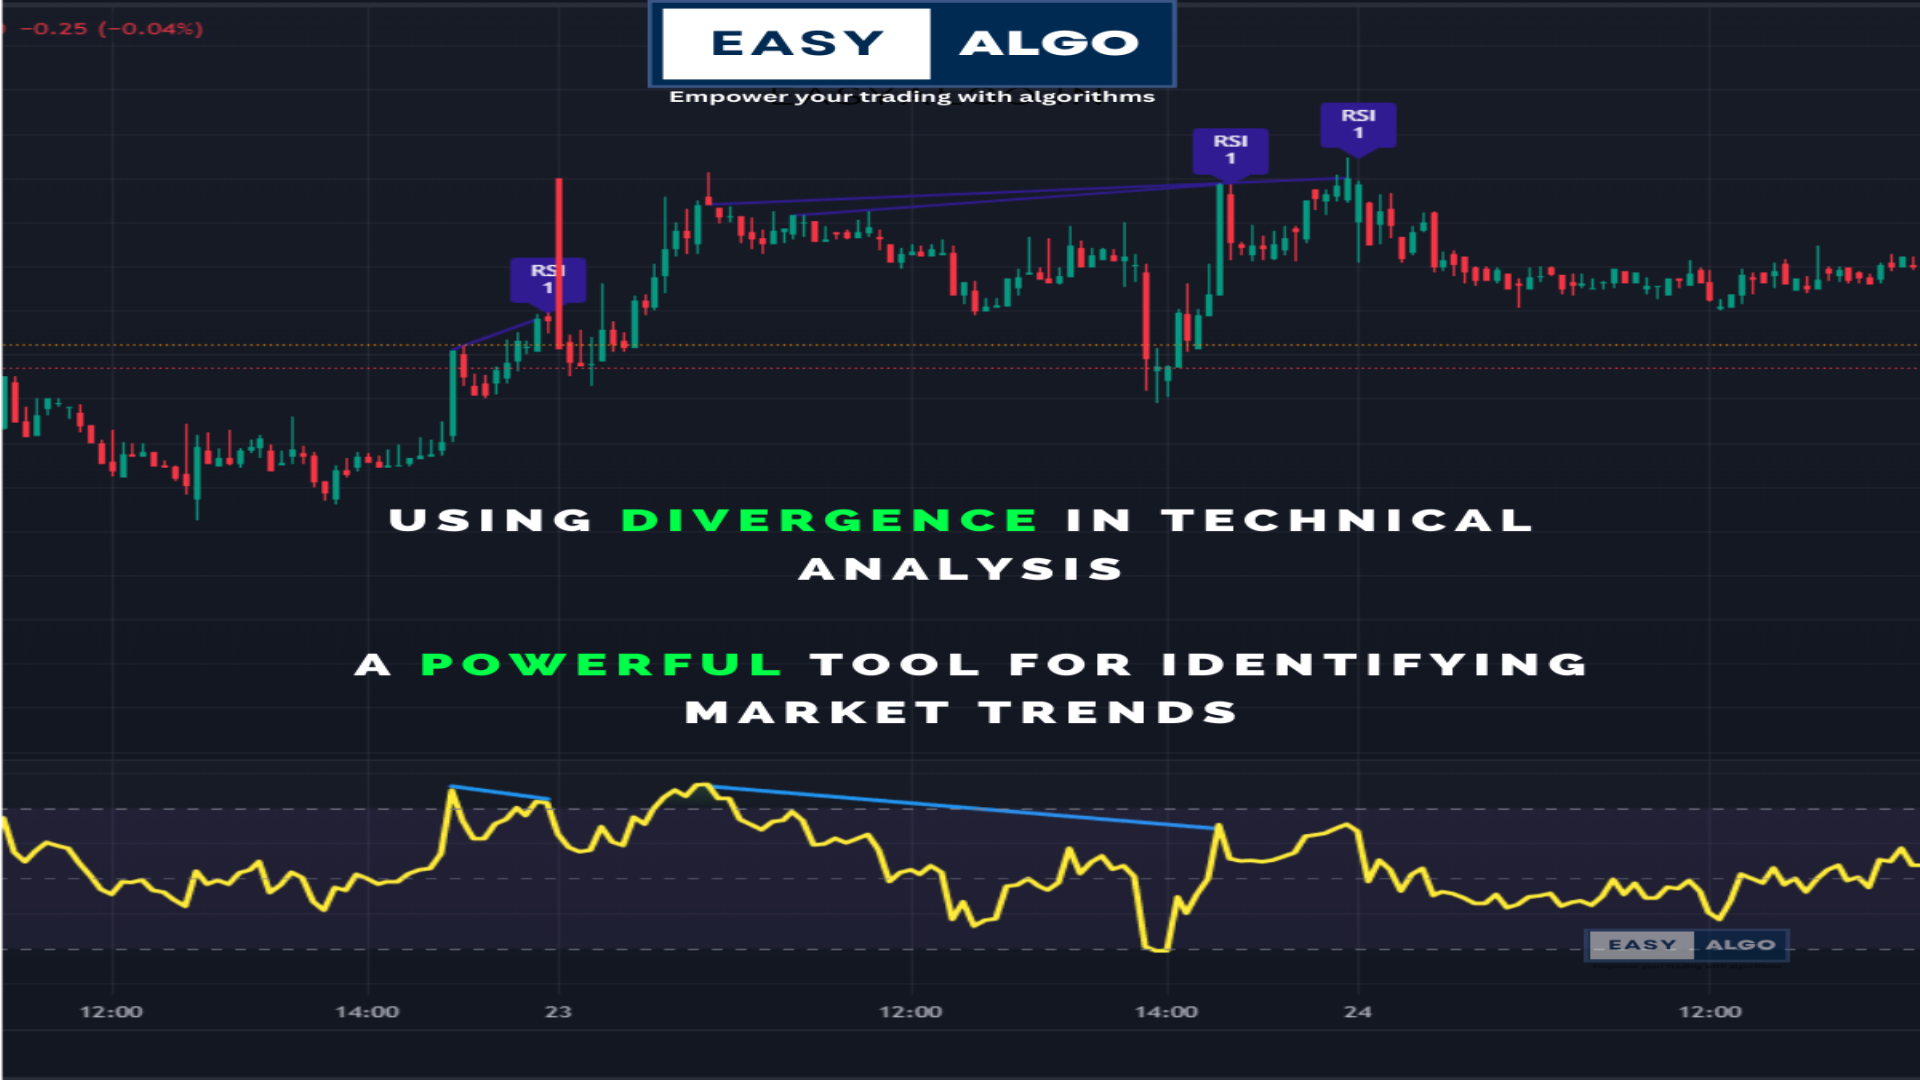
Using Divergence in Technical Analysis A Powerful Tool for Identifying Market Trends
Divergence is a technical analysis tool used by traders to identify potential trend reversals in
financial markets.
It happens when the price of an asset moves in the opposite direction of an
indicator, such as the Relative Strength Index (RSI) or Moving Average Convergence Divergence
(MACD).
There are two types of divergence: bullish and bearish. Bullish divergence occurs when the price of
an asset makes a lower low while the indicator makes a higher low, suggesting that the momentum is
increasing and indicating a potential trend reversal to the upside.
Bearish divergence occurs when
the price of an asset makes a higher high while the indicator makes a lower high, suggesting that
the momentum is decreasing and indicating a potential trend reversal to the downside.
Traders can use divergence to identify potential trading opportunities.
For example, finding bullish
divergence on a stock chart could indicate that the stock is bottoming out and may move higher,
making it a good time to enter a long position.
Conversely, finding bearish divergence could
indicate that the stock is topping out and may move lower, making it a good time to enter a short
position.
At EasyAlgo, we specialize in automating trading strategies and backtesting them to ensure maximum
profitability.
If you have a trading idea but don't know how to automate it, or if you want to
backtest your trading strategy but don't know where to start, contact us at +91-8851987919 or visit
our website at easyalgo.in .
Don't miss out on the potential profits that come with trading smarter, not harder. Let EasyAlgo
help you take your trading strategy to the next level.

